
AVGO – Breakdown Below HVL, Gap Fill Toward 320, Protective Put Support Zone
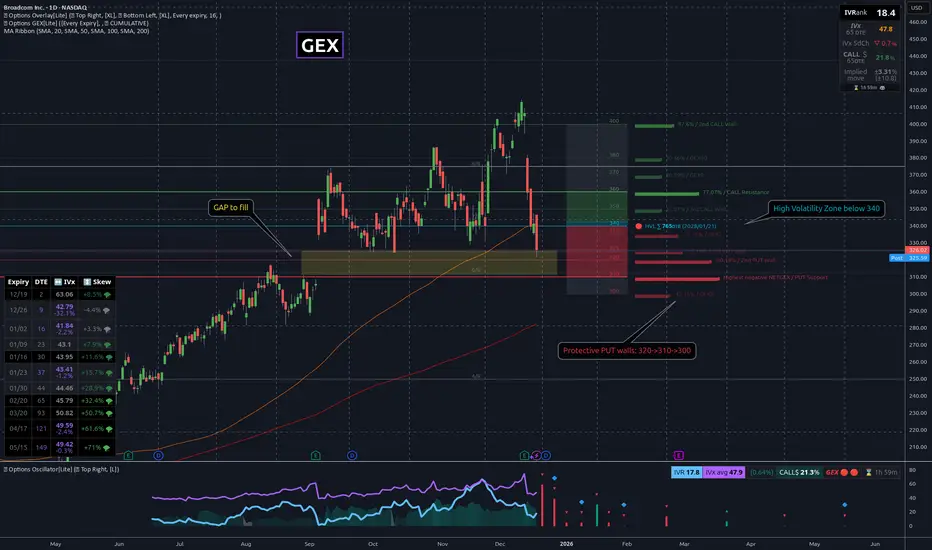
AVGO is trading in a high-volatility, momentum-driven downside phase, following a clean breakdown below the HVL. The move marks a clear regime shift, as price exited a tight transition zone and accelerated lower with conviction.
The downside was well signaled by sustained put-side pressure over multiple sessions, with price repeatedly rejecting from the 50 EMA. Once HVL failed, downside momentum expanded rapidly, consistent with a retail-driven move rather than a controlled dealer-defended range.
From an options structure perspective, protective put positioning now defines the next meaningful downside reference. Current positioning shows the next major protective put support clustered around 320, which also aligns with a clean gap-fill level on the chart.
This makes 320 a dual-confluence area:
Until that zone is reached, price is effectively moving through thin structure, where volatility expansion and sharp intraday swings should be expected.
Key levels & structure:
Any stabilization or bounce attempts are more likely to occur only after interaction with the 320 area, not before.
AVGO is trading in a high-volatility, momentum-driven downside phase, following a clean breakdown below the HVL. The move marks a clear regime shift, as price exited a tight transition zone and accelerated lower with conviction.
The downside was well signaled by sustained put-side pressure over multiple sessions, with price repeatedly rejecting from the 50 EMA. Once HVL failed, downside momentum expanded rapidly, consistent with a retail-driven move rather than a controlled dealer-defended range.
From an options structure perspective, protective put positioning now defines the next meaningful downside reference. Current positioning shows the next major protective put support clustered around 320, which also aligns with a clean gap-fill level on the chart.
This makes 320 a dual-confluence area:
- technical gap fill
- protective put floor where dealer hedging dynamics may begin to dampen downside momentum
Until that zone is reached, price is effectively moving through thin structure, where volatility expansion and sharp intraday swings should be expected.
Key levels & structure:
- Below HVL → bearish regime confirmed
- 50 EMA → repeated rejection, trend continuation signal
- 320 → primary downside target & potential stabilization zone (gap fill + protective puts)
Any stabilization or bounce attempts are more likely to occur only after interaction with the 320 area, not before.

Boost up your charts with Options PRO!
REAL Options metrics for over 250+ liquid US symbols:
✔ 𝗔𝘂𝘁𝗼-𝗨𝗽𝗱𝗮𝘁𝗶𝗻𝗴 𝗚𝗘𝗫 𝗹𝗲𝘃𝗲𝗹𝘀
✔ GEX ✔ IVRank ✔ CALL/PUT skew ✔ Volatility✔ Delta curves
👉 7-day FREE TRIAL 🌐 TanukiTrade.com
REAL Options metrics for over 250+ liquid US symbols:
✔ 𝗔𝘂𝘁𝗼-𝗨𝗽𝗱𝗮𝘁𝗶𝗻𝗴 𝗚𝗘𝗫 𝗹𝗲𝘃𝗲𝗹𝘀
✔ GEX ✔ IVRank ✔ CALL/PUT skew ✔ Volatility✔ Delta curves
👉 7-day FREE TRIAL 🌐 TanukiTrade.com
Related publications
Disclaimer
The information and publications are not meant to be, and do not constitute, financial, investment, trading, or other types of advice or recommendations supplied or endorsed by TradingView. Read more in the Terms of Use.