
INTRODUCTION:
The hyperscaler approach to what passes for "AI" is unsustainable. They promised too much, they spent too much, and they keep borrowing too much. Now that the numbers are laughably astronomical, sooner or later, someone's gonna blink and the looking-for-a-way-out is gonna start, sector-wide. That's when the music stops.
The above being said, "AI" is here to stay, but in the opinion of the author of this idea, it will end up commodified, like the internet. Huge piles of hardware won't matter as far a revenues go, similarly to how giant spools of fiber optics didn't matter after the dot.com crash. Lets dispense with the bull of AGI. Tiny but still useful LLMs will be ran locally on purpose-built, ultra-low-power chips that can be installed into a smartphone or a fridge. The magic will be in what people with limited means can do with the tech, not those who have a billion dollars to burn on tokens from the hyperscaler-adjacent labs like OpenAI, Anthropic, xAI, and Meta.
This is where BraniChip comes in. Ultra-low-power neuromorphic chips that exclusively run small, purpose-built LLMs and their derivatives. They even have their own software environment, similar to how Nvidia has CUDA (if I'm not mistaken about how that works).
None of the above would matter, however, if it weren't for the chart.
THE TA:
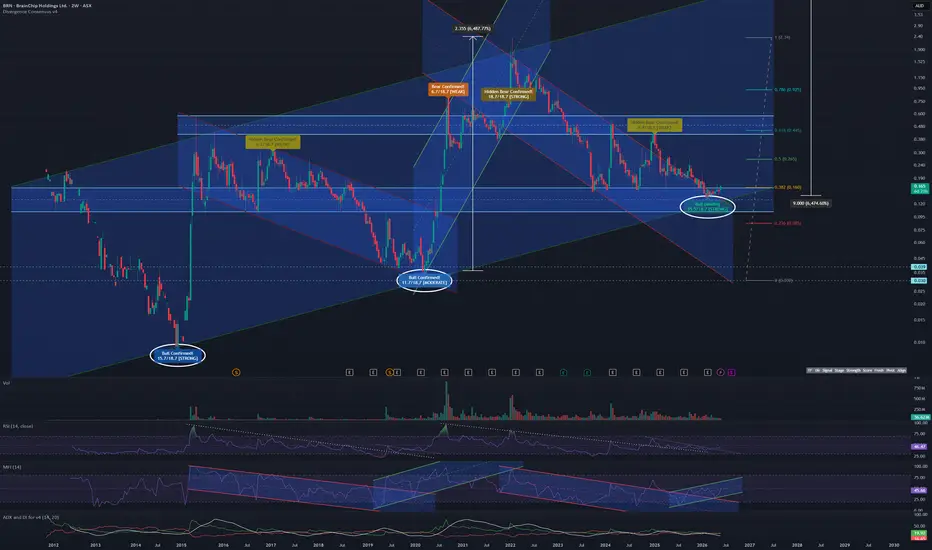
Based on the above 2W which offers the most reliable signals and cleanest structures, I'm listing the following bullish observations:
1. The whole thing is cyclical. The chart begins with a structural high and a structural low, and then new structural higher highs and higher lows print at the end of multi-year uptrends and downtrends.
2. New multi-year uptrends begin once price action levels-out in or on horizontal regions of past support/resistance. This is happening right now.
3. Price action has retraced from the last structural higher high down to the 0.382 Fib level, where it is now consolidating (or is already done consolidating).
4. RSI and MFI are both out of resistance, with the latter already in uptrend, an uptrend which is also printing local higher highs as the price action printed local lower lows — a bullish divergence.
5. The Divergence Consensus tool from without_worries, now prints a pending (not yet confirmed) strong bullish divergence across 15+ separate indicators in the exact same place divergences of similar strength had printed before the previous two multi-year uptrends.
6. The full bull flag extension from the previous cycle takes price action to the $9AUD area, which is pretty much where one would expect the next structural higher high to print in the entire structural uptrend.
7. The 2M chart below has a fresh DOJI. There was a DOJI in pretty much the same area on the cusp of the previous cycle-up.

FINAL NOTES:
A perfect entry would be at $0.1-0.11, as indicated by the bottom of the horizontal legacy support/resistance channel in which price action is currently moving. There is no guarantee, however, that price action will still visit the bottom of that horizontal, despite the fact it had wicked down to the bottom of the previous one, before the previous cycle-up. Case in point — once a divergence signal printed from the Divergence Consensus tool, in both previous instances price action did not continue to the downside, only upside.
Exposure to this company is also available on the American OTC markets, though chart history is limited there.
***
The above was written by hand.
The above is not investment advice.
I'm not a professional analyst or trader.
The hyperscaler approach to what passes for "AI" is unsustainable. They promised too much, they spent too much, and they keep borrowing too much. Now that the numbers are laughably astronomical, sooner or later, someone's gonna blink and the looking-for-a-way-out is gonna start, sector-wide. That's when the music stops.
The above being said, "AI" is here to stay, but in the opinion of the author of this idea, it will end up commodified, like the internet. Huge piles of hardware won't matter as far a revenues go, similarly to how giant spools of fiber optics didn't matter after the dot.com crash. Lets dispense with the bull of AGI. Tiny but still useful LLMs will be ran locally on purpose-built, ultra-low-power chips that can be installed into a smartphone or a fridge. The magic will be in what people with limited means can do with the tech, not those who have a billion dollars to burn on tokens from the hyperscaler-adjacent labs like OpenAI, Anthropic, xAI, and Meta.
This is where BraniChip comes in. Ultra-low-power neuromorphic chips that exclusively run small, purpose-built LLMs and their derivatives. They even have their own software environment, similar to how Nvidia has CUDA (if I'm not mistaken about how that works).
None of the above would matter, however, if it weren't for the chart.
THE TA:
Based on the above 2W which offers the most reliable signals and cleanest structures, I'm listing the following bullish observations:
1. The whole thing is cyclical. The chart begins with a structural high and a structural low, and then new structural higher highs and higher lows print at the end of multi-year uptrends and downtrends.
2. New multi-year uptrends begin once price action levels-out in or on horizontal regions of past support/resistance. This is happening right now.
3. Price action has retraced from the last structural higher high down to the 0.382 Fib level, where it is now consolidating (or is already done consolidating).
4. RSI and MFI are both out of resistance, with the latter already in uptrend, an uptrend which is also printing local higher highs as the price action printed local lower lows — a bullish divergence.
5. The Divergence Consensus tool from without_worries, now prints a pending (not yet confirmed) strong bullish divergence across 15+ separate indicators in the exact same place divergences of similar strength had printed before the previous two multi-year uptrends.
6. The full bull flag extension from the previous cycle takes price action to the $9AUD area, which is pretty much where one would expect the next structural higher high to print in the entire structural uptrend.
7. The 2M chart below has a fresh DOJI. There was a DOJI in pretty much the same area on the cusp of the previous cycle-up.
FINAL NOTES:
A perfect entry would be at $0.1-0.11, as indicated by the bottom of the horizontal legacy support/resistance channel in which price action is currently moving. There is no guarantee, however, that price action will still visit the bottom of that horizontal, despite the fact it had wicked down to the bottom of the previous one, before the previous cycle-up. Case in point — once a divergence signal printed from the Divergence Consensus tool, in both previous instances price action did not continue to the downside, only upside.
Exposure to this company is also available on the American OTC markets, though chart history is limited there.
***
The above was written by hand.
The above is not investment advice.
I'm not a professional analyst or trader.
Note
There is a small error in paragraph 4 of the "TA" section. My original description incorrectly states that the bullishly divergent MFI uptrend is printing local higher highs versus the local lower lows of the price action. As per what's on the chart (which is correct), the MFI uptrend is printing local *higher lows*.Note
Saw an argument today that the 3M market structure of BRN is broken and therefore one shouldn't long BRN because one shouldn't be longing anything that has a broken market structure in general. A wild and shortsighted generalization, in my opinion. Any chartist seeking value and alpha plays *must* long under market structures provided resistances are broken and horizontal supports are intact. Here is the chart that was presented to substantiate the argument:
Apart from the chart's diagonal uptrend channel being imprecise as far as confluence points go (ignoring wicks at those sky-high timeframes is a mistake in my opinion), the TA fails to account for legacy structures which are still present and influencing the chart.
Below is my response chart on the same timeframe:
It is obvious, that not longing at $0.04 AUD after the second market structure was broken in the later parts of 2018, one would have missed out on significant gains. Current price action is pretty much in the exact same position, just one cycle over, as per the overall cyclicality of BRN and the pending bullish divergences that are printing like clockwork on the 2W every time price action finds itself under these conditions. Lastly, RSI is clearly out of resistance, as it was during the previous cycle-up. It's just still in consolidation (as evidenced by the bullishly divergent 2W MFI in the original idea).
Trade active
Using the update function to draw attention to the note I've just added. I've been long BRN for a good while before publishing the original idea. My current average is 0.195. 
Disclaimer
The information and publications are not meant to be, and do not constitute, financial, investment, trading, or other types of advice or recommendations supplied or endorsed by TradingView. Read more in the Terms of Use.
Disclaimer
The information and publications are not meant to be, and do not constitute, financial, investment, trading, or other types of advice or recommendations supplied or endorsed by TradingView. Read more in the Terms of Use.