BITCOIN broke above the accumulation curve! See how to trade it!
Bitcoin broke through the final MA barrier (1W MA100) and even crossed over the Historical Parabolic Accumulation Curve. This is a very significant development as it this curve has been used historically as a strong buy zone during the distribution phase before every logarithmic bull run. Doesn't this mean that the new bull market will be even more aggressive than we thought? Maybe. Let's look at the possibilities.
During the recent bear market BTC traded on Lower Highs before the final crash in November 2018. Those Lower Highs where contained below a Resisting Curve. There is always the possibility that this Curve will extend into the new Bull Market also providing Resistance.
The very same Resisting Curve was present during the 2014 - 2016 cycle.

Basically Bitcoin seems to be "attacking" those Lower High levels now, which act as resistances and may provide bull backs that I will buy. The current supply zone is within 5000 - 6000 now.
So now, what happened last time the price broke the Parabolic Accumulation Curve?
1. In November 2015 it broke it, extended to +155% and immediately was rejected back to the Accumulation Curve, testing its Support.
2. In June 2017 it broke it, extended +230% and was rejected to the top of the Accumulation Curve where it found Support and went on a new relentless rally to the 19700 All Time Highs.
If those patterns are repeated this is how the present situation may look like before the rally continues:
Which ever scenario prevails one thing is for sure. BTC is back to its extreme bullish behavior on a logarithmic scale and those who bought near the 3150 bottom, against the popular (then) bearish sentiment, don't regret it. The signs for buying in the 3000 region where too many:
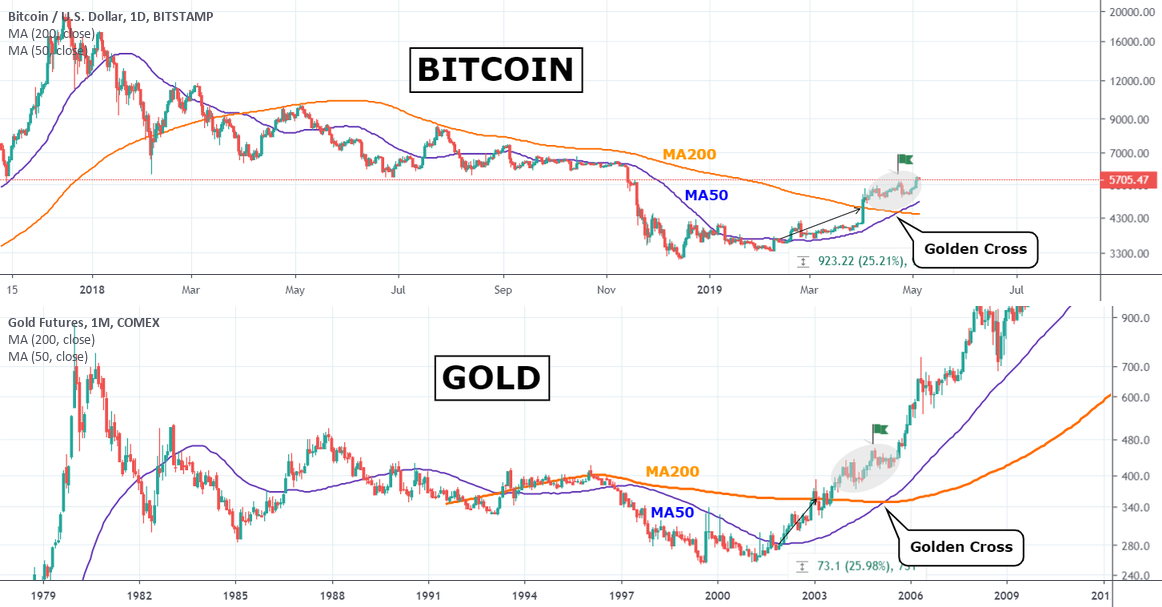
One of those were the resemblences with Gold's bottom pattern. The perfect long term BUY SIGNAL given back in February. See how beautifully it follows the bullish arrow, as Gold did:
The Golden Cross again with references to Gold. Fairly obvious too:
The Inverse Fractal was another one:
... and so was the first bullish month after the bottom:
The question you should be asking yourselves is this: "Am I willing to miss the chance again?". The new bull market has started, still has enormous possibilities and new Highs to make:
What do you think? Are we still too early in the new bull cycle? Is this still a very low price to but Bitcoin? As usual let me know in the comments section!!
During the recent bear market BTC traded on Lower Highs before the final crash in November 2018. Those Lower Highs where contained below a Resisting Curve. There is always the possibility that this Curve will extend into the new Bull Market also providing Resistance.
The very same Resisting Curve was present during the 2014 - 2016 cycle.
Basically Bitcoin seems to be "attacking" those Lower High levels now, which act as resistances and may provide bull backs that I will buy. The current supply zone is within 5000 - 6000 now.
So now, what happened last time the price broke the Parabolic Accumulation Curve?
1. In November 2015 it broke it, extended to +155% and immediately was rejected back to the Accumulation Curve, testing its Support.
2. In June 2017 it broke it, extended +230% and was rejected to the top of the Accumulation Curve where it found Support and went on a new relentless rally to the 19700 All Time Highs.
If those patterns are repeated this is how the present situation may look like before the rally continues:
Which ever scenario prevails one thing is for sure. BTC is back to its extreme bullish behavior on a logarithmic scale and those who bought near the 3150 bottom, against the popular (then) bearish sentiment, don't regret it. The signs for buying in the 3000 region where too many:
One of those were the resemblences with Gold's bottom pattern. The perfect long term BUY SIGNAL given back in February. See how beautifully it follows the bullish arrow, as Gold did:

The Golden Cross again with references to Gold. Fairly obvious too:
The Inverse Fractal was another one:

... and so was the first bullish month after the bottom:

The question you should be asking yourselves is this: "Am I willing to miss the chance again?". The new bull market has started, still has enormous possibilities and new Highs to make:


What do you think? Are we still too early in the new bull cycle? Is this still a very low price to but Bitcoin? As usual let me know in the comments section!!
👑Best Signals (Forex/Crypto+70% accuracy) & Account Management (+20% profit/month on 10k accounts)
💰Free Channel t.me/tradingshotglobal
🤵Contact info@tradingshot.com t.me/tradingshot
🔥New service: next X100 crypto GEMS!
💰Free Channel t.me/tradingshotglobal
🤵Contact info@tradingshot.com t.me/tradingshot
🔥New service: next X100 crypto GEMS!