
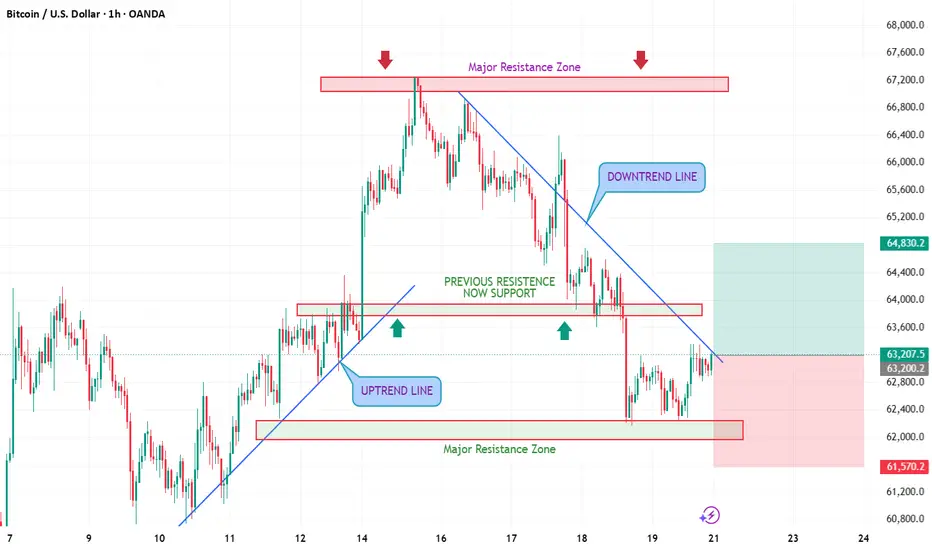
Bitcoin is currently trading inside a critical zone after experiencing a strong rejection from the major resistance area around 67,200. Following that rejection, price began forming lower highs and lower lows, establishing a clear short-term downtrend, which is highlighted by the descending trendline on the chart.
One of the most important levels to watch is the 63,700–64,000 zone. This area previously acted as resistance before being broken to the upside, turning into support. However, after multiple tests, sellers managed to push price back below it. This breakdown shifted market sentiment and confirmed bearish pressure in the short term.
Despite the recent weakness, buyers have stepped in aggressively around the 62,000 support zone, preventing a deeper selloff. The latest bounce from this level suggests that demand is still present, and the market is now attempting to recover. As long as price remains above 62,000, bulls still have a chance to regain control.
The key factor now is the descending trendline. Bitcoin remains below this trendline, meaning the bearish structure is technically still intact. For a bullish continuation, price needs to break above the trendline and reclaim the 63,700–64,000 area as support. A successful breakout and retest could open the door for a move toward 64,800, 65,500, and potentially 66,400.
On the other hand, if price fails to break the trendline and gets rejected again, sellers may attempt another push toward the 62,000 support zone. A clean break below 62,000 would likely trigger further downside and could send BTC toward lower liquidity levels.
My Outlook
At the moment, I remain cautiously bearish while price trades below the descending trendline and below the former support zone around 64,000. However, the strong reaction from the 62,000 support area means I am not looking for aggressive shorts unless that support breaks.
Bullish confirmation: Break and hold above 64,000.
Bearish confirmation: Hourly close below 62,000.
Key Levels
🔴 Resistance: 64,000 → 65,500 → 66,400 → 67,200
🟢 Support: 62,000 → 61,500 → 61,000
Conclusion: Bitcoin is approaching a decision point. A breakout above the trendline could trigger a bullish recovery, while rejection below resistance keeps the bearish structure intact. The next move is likely to be determined by how price reacts between 62,000 support and 64,000 resistance.
This analysis is based on price action and market structure and is for educational purposes only, not financial advice.
Trade active
BTC has already broken above the descending trendline that was acting as resistance and is now holding above the former resistance zone around 63,600–63,800, which has flipped back into support. This is a bullish structural development and suggests buyers are regaining control after the recent correction. As long as Bitcoin remains above this support area, the next likely move is a continuation toward 64,800–65,500, where the first significant resistance cluster lies. A successful break above that region could open the door for a retest of the major supply zone around 66,900–67,200, which remains the key resistance area on the chart. However, if BTC loses the 63,600 support and falls back below the breakout level, the bullish momentum would weaken and price could revisit the 62,000–62,300 demand zone before attempting another recovery. For now, the bias remains cautiously bullish, with the trendline breakout and support reclaim favoring further upside as long as buyers defend the current levels.
Disclaimer
The information and publications are not meant to be, and do not constitute, financial, investment, trading, or other types of advice or recommendations supplied or endorsed by TradingView. Read more in the Terms of Use.
Disclaimer
The information and publications are not meant to be, and do not constitute, financial, investment, trading, or other types of advice or recommendations supplied or endorsed by TradingView. Read more in the Terms of Use.