
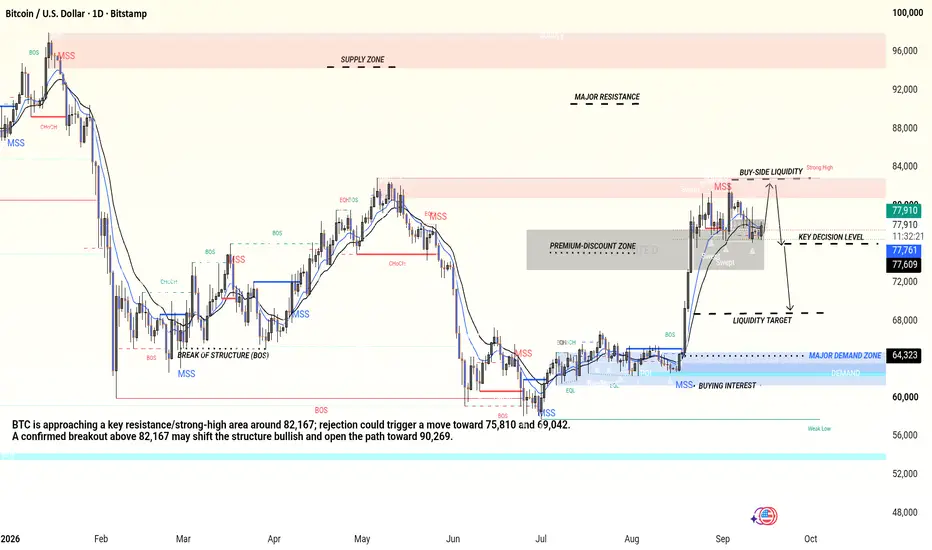
This analysis focuses on candle behaviour, market structure, liquidity, MSS, BOS, supply/demand and key levels. Each major candle sequence is interpreted according to its location and reaction, rather than treating every candle as an isolated signal.
1 Initial Bullish Expansion — 2026 Start
The early candles show bullish momentum, with buyers progressively pushing price into higher levels. Consecutive bullish candles and higher highs indicate that demand was controlling the short-term structure.
The candles that leave lower wicks show that sellers attempted to push price down but were absorbed by buyers.
2️⃣ 96K–98K — Liquidity & Supply Reaction
As price reached the upper supply zone, candles started showing rejection. The long upper wicks indicate that buying pressure was being met by significant selling interest.
The following bearish candles confirmed that price was unable to sustain the highs.
Reason: price reached a major HTF supply/liquidity area and sellers became active.
3️⃣ Bearish Displacement
The large bearish candles following the high represent strong bearish displacement. Instead of a normal pullback, price broke several previous swing lows.
This created the first important MSS, followed by bearish continuation.
Reason: previous bullish structure was invalidated and sellers gained control.
4️⃣ Consolidation Around 60K–65K
After the sharp decline, candles became smaller and more balanced. Several upper and lower wicks appeared around the 60K–64K region.
This behaviour suggests consolidation and liquidity accumulation rather than a clean directional trend.
The repeated reactions from the lower area established the HTF Demand Zone.
5️⃣ MSS & BOS — Recovery Phase
Once price began producing higher lows, a bullish MSS appeared. Subsequent bullish candles broke previous swing highs, confirming BOS.
The larger bullish candles show displacement, while the smaller bearish candles represent pullbacks into areas where buyers were able to defend price.
6️⃣ 64,323 Demand Zone
The 64,323 area is an important structural support/demand level.
When price returned toward this area, candles showed rejection and buyers stepped in. The resulting bullish displacement helped establish the upward move toward the current 77K–82K region.
7️⃣ Rally Toward 82,167
The strong bullish candle sequence from the demand area shows aggressive buying pressure.
As price approached 82,167, momentum started slowing and upper wicks appeared. This is important because 82,167 is marked as the Strong High / Buy-Side Liquidity area.
8️⃣ Liquidity Sweep Near the High
The candles around the recent high show price moving into the upper liquidity area before rejecting.
A sweep alone is not confirmation of reversal. Confirmation comes from subsequent bearish displacement and a structural break.
9️⃣ Current 77K–78K Area
Price is currently consolidating around the 77,700–77,800 region. The smaller candles and repeated wicks indicate indecision after the previous bullish expansion.
The grey OTE/decision area should therefore be treated as an area of interest rather than an automatic entry.
🔻 Bearish Scenario
If bearish candles produce a confirmed break below 75,810, the next areas of interest become:
75,810 → 69,042 → 64,323
A strong daily close below a level is more meaningful than a temporary wick.
🔼 Bullish Scenario
If buyers regain momentum and price produces a confirmed breakout above 82,167, the next major liquidity/resistance area is around:
82,167 → 90,269
A breakout followed by a successful retest would provide stronger structural confirmation than simply touching the level.
🧠 Candle Reading Summary
Large bullish candles: bullish displacement / aggressive buying.
Large bearish candles: bearish displacement / aggressive selling.
Long upper wick: rejection or buy-side liquidity sweep.
Long lower wick: rejection or sell-side liquidity sweep.
Small-body candles: consolidation/indecision.
Bullish candle after demand: potential buyer response.
Bearish candle after supply: potential seller response.
BOS: continuation of the established structure.
MSS: potential change in market direction.
Sweep + displacement: stronger confirmation than a sweep alone.
📌 Key Levels
98K–96K: HTF Supply
90,269: Major Resistance / Liquidity
82,167: Strong High / Buy-Side Liquidity
77,737: Key Decision Area
75,810: Key Support
69,042: Downside Liquidity Target
64,323: HTF Demand
Important: This is a technical market-structure analysis, not a guaranteed prediction or financial advice. Trade decisions should be based on confirmation, defined invalidation and appropriate risk management.
Trade active
1000+ pips running profit keep strong hold wait for my last target it's coming soonTrade closed manually

Related publications
Disclaimer
The information and publications are not meant to be, and do not constitute, financial, investment, trading, or other types of advice or recommendations supplied or endorsed by TradingView. Read more in the Terms of Use.
Related publications
Disclaimer
The information and publications are not meant to be, and do not constitute, financial, investment, trading, or other types of advice or recommendations supplied or endorsed by TradingView. Read more in the Terms of Use.