BTCUSD - New Study With $15,187.57 to $15,901.40 Range Target.
I’m re-posting this publication because it appears I have violated TradingView rules. I’m not sure exactly which one. It may be that I shared my link for a referral…. Not sure…. It now says, "Hidden..." So, I’m posting this again. My apologies for violating rules TradingView Support Team.
Hi Everyone... As many of you have followed me for a while know, I have favored a target of $14,611.32 since April 18, 2020. I'm still using my same FIB Extension Formula with my 0.618 at highest wick and highest close to determine a 1.618 FIB Extension Range. I'm simply using different coordinates. Ultimately, we will still use the indicators to determine when we may likely be nearing the top. However, there is no harm determining a potential target range where we may be heading.
I will explain why I'm doing this study in a video some day soon. Right now, I'm going to get out for a walk with my wife and son.
Happy Trading and Stay Awesome!
David

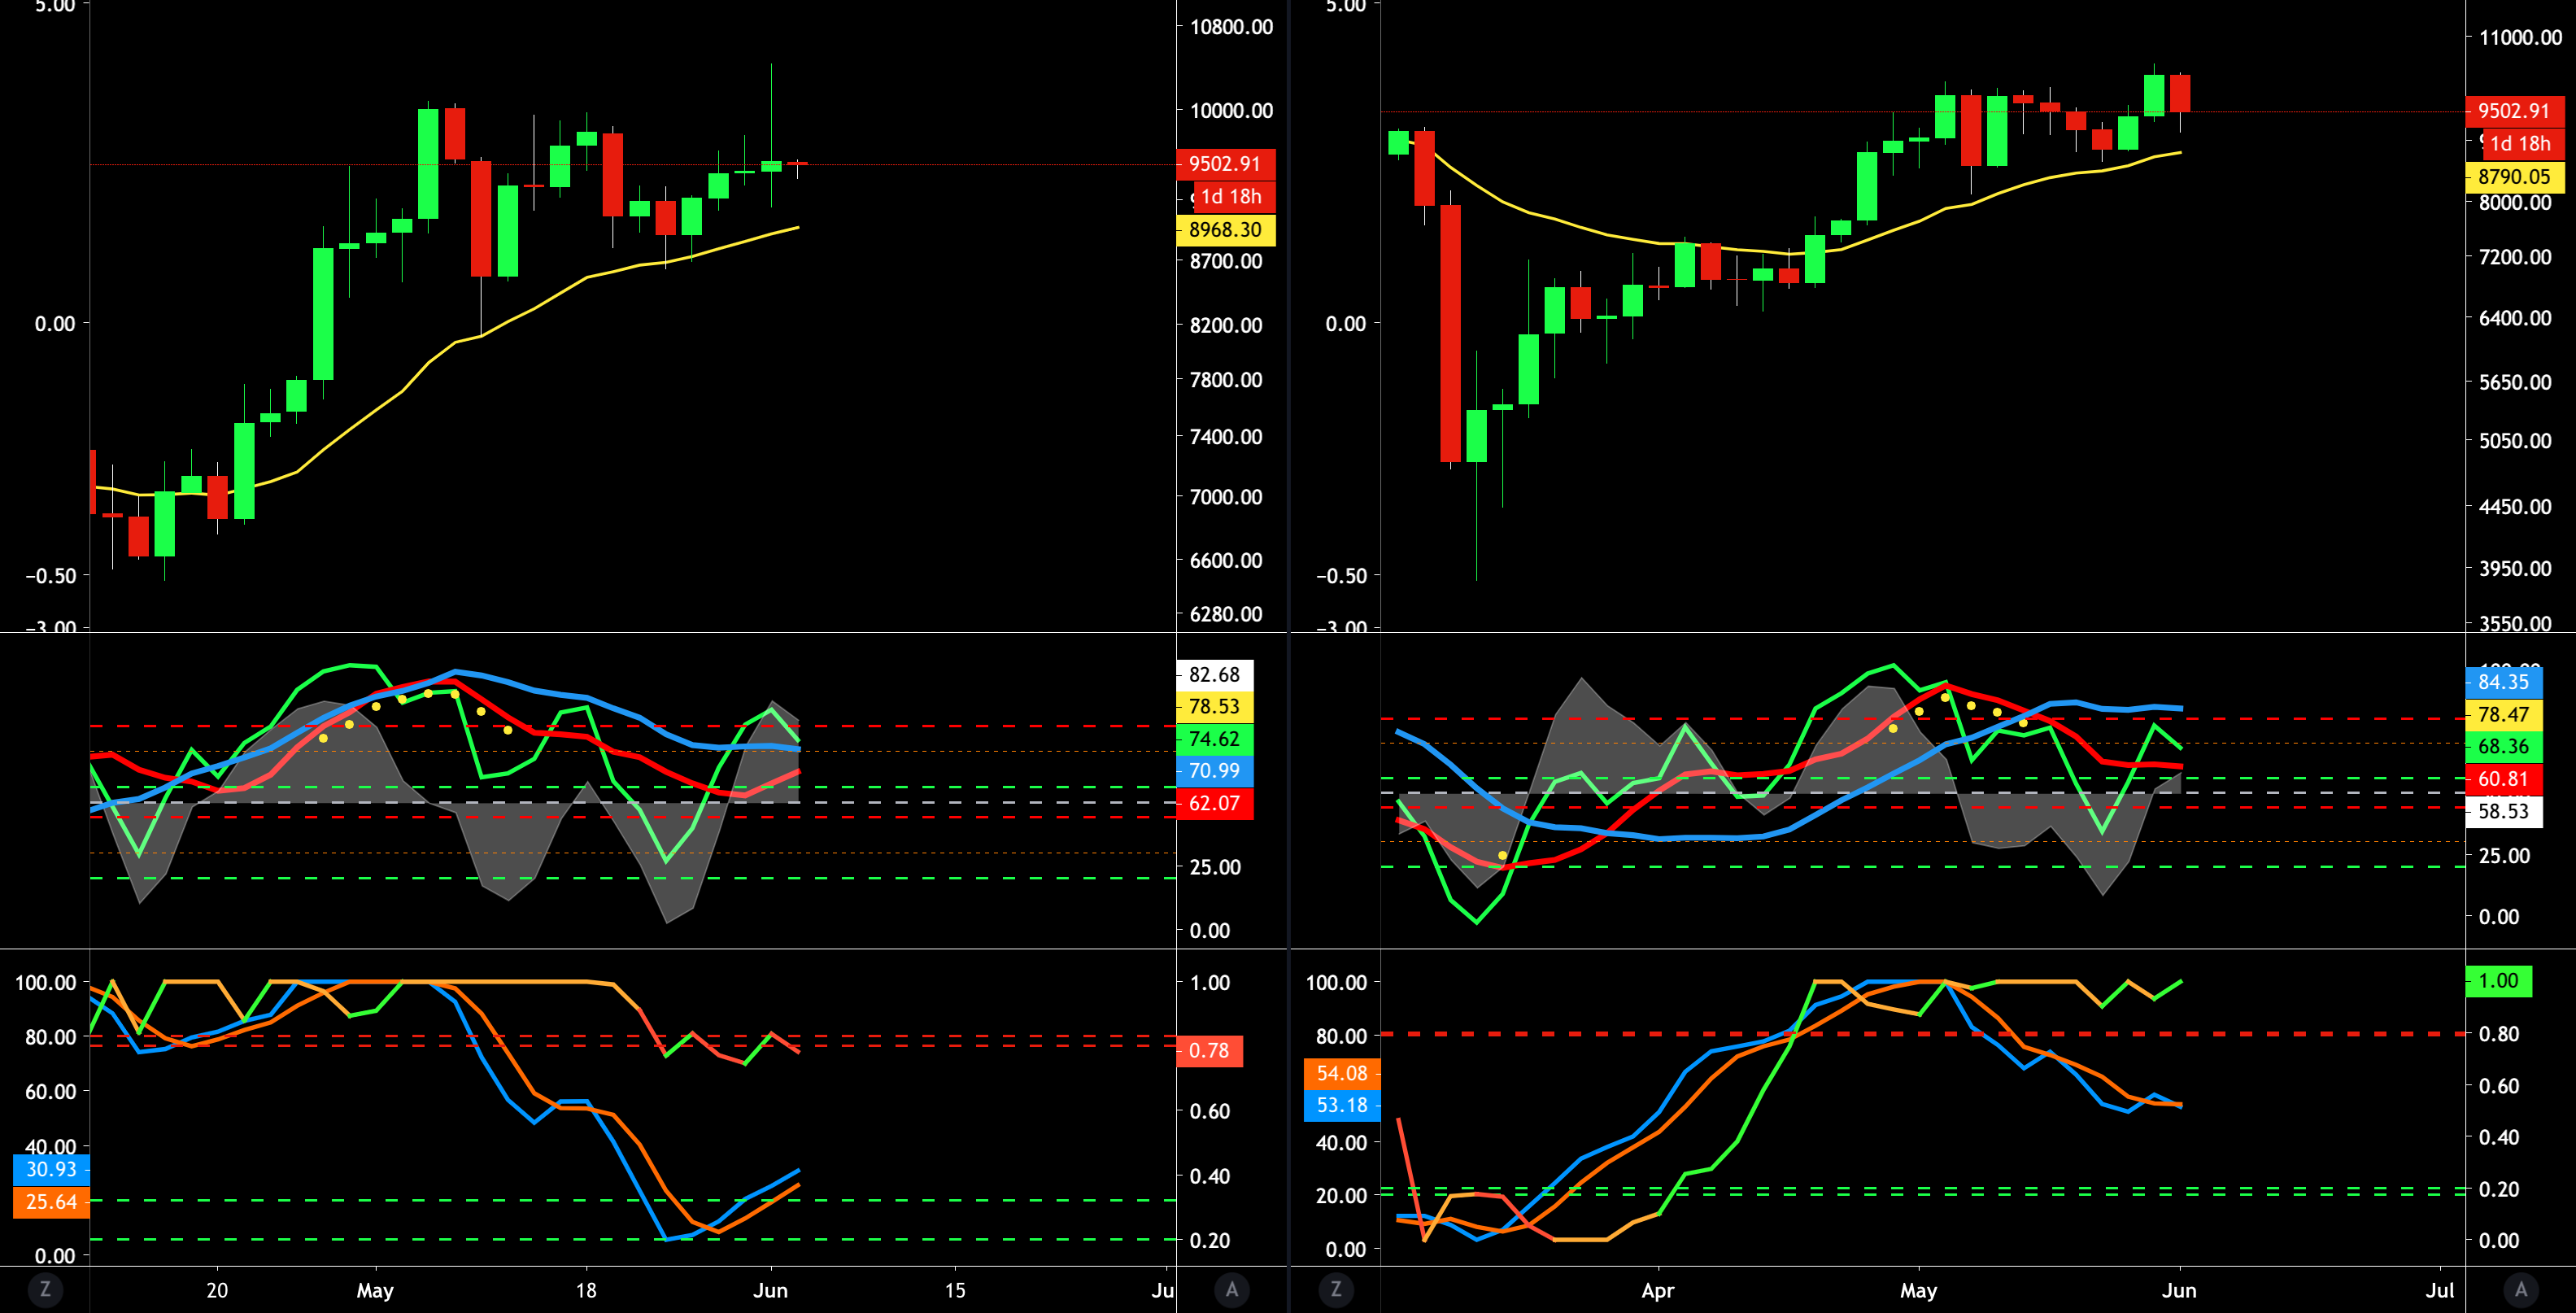
A quick look at our common occurrence of the Stochastic RSI having a small pullback (dip) around the 80 level when it rises up with the Phoenix Ari.
3 hour time frame:
6 hour time frame:
12 hour time frame:
Another example of the Green Line at a higher level than the White Energy equates to a bullish trend as long as the Green Line remains at a higher level than the White Energy. This example of from June, 2019.
12 hour time frame:
Look at the indicator lines I've drawn to provide a "visual" of what I see coming in the 2-Day TF. Those who are saying this is the making of an inverse head and shoulders will be sadly mistaken. My opinion of course.
Hi Everyone... As many of you have followed me for a while know, I have favored a target of $14,611.32 since April 18, 2020. I'm still using my same FIB Extension Formula with my 0.618 at highest wick and highest close to determine a 1.618 FIB Extension Range. I'm simply using different coordinates. Ultimately, we will still use the indicators to determine when we may likely be nearing the top. However, there is no harm determining a potential target range where we may be heading.
I will explain why I'm doing this study in a video some day soon. Right now, I'm going to get out for a walk with my wife and son.
Happy Trading and Stay Awesome!
David
A quick look at our common occurrence of the Stochastic RSI having a small pullback (dip) around the 80 level when it rises up with the Phoenix Ari.
3 hour time frame:
6 hour time frame:
12 hour time frame:
Another example of the Green Line at a higher level than the White Energy equates to a bullish trend as long as the Green Line remains at a higher level than the White Energy. This example of from June, 2019.
12 hour time frame:
Look at the indicator lines I've drawn to provide a "visual" of what I see coming in the 2-Day TF. Those who are saying this is the making of an inverse head and shoulders will be sadly mistaken. My opinion of course.
Comment:
As a heads up... Do not put your referral link into the body of your publications. Premium members can place them in their "signature" without violating rules.
Comment:
My sincere apologies, TradingView. No harm was intended... Please forgive my ignorance.
Stay Awesome!
David
Stay Awesome!
David
Comment:
When something like this occurs, they are often unexpected surprises out of the blue that are fast and quick for the "shakeout" purposes.
Comment:
You can expect "Stop Hunts" and "Shakeouts" like this during this period of upward pressure.
Comment:
November, 2012:
September, 2013 is an excellent example of a "Stop Hunt" / "Shakeout" event before a MAJOR move. We'll have to discuss this more in an upcoming video later this evening.
September, 2013 is an excellent example of a "Stop Hunt" / "Shakeout" event before a MAJOR move. We'll have to discuss this more in an upcoming video later this evening.
Comment:
Look at the 1 minute TF on Bitmex Perpetual Swap. OBVIOUS "Stop/Liquidation Hunt." My opinion of course. Which is why I use other exchanges.
Comment:
Is it possible they could still drop this hard again for liquidation purposes? Sure... This was total manipulation out of nowhere to liquidate margin bets on normal and cross leverage on Bitmex. My opinion of course. This may not be done yet. We'll have to keep an eye on it.
Example of a similar BITMEXT "Stop/Liquidation Hunt."
Example of a similar BITMEXT "Stop/Liquidation Hunt."
Comment:
It's actually POSSIBLE this could revert into a November/December, 2012 sideways event all over again for the purposes of accumulation before a MAJOR PUSH UPWARD.. Which means we could go sideways potentially for a LONG TIME with a LOT of "Stop/Liquidation Hunting" before the BIG MOVE UPWARD. This will be discussed in a video publication later.
Comment:
This isn't good. We may not be done yet...
Comment:
This can still continue with downward pressure a while when looking at the 3h. If your stop was triggered, you may want to wait a bit before considering re-entry.
Comment:
This is precisely why I don't want to celebrate TA too soon without us CLOSING above the $10,500.50 price point I've mentioned for so long.
Comment:
Wyckoff Mode Bitcoin LIVE Stream
LIVE COVERAGE of Bitcoin Price Action
www.tradingview.com/...q7oxPpF-TfVpEWCo8wg/
LIVE COVERAGE of Bitcoin Price Action
www.tradingview.com/...q7oxPpF-TfVpEWCo8wg/
Comment:
New stream link. www.tradingview.com/...waPhneqGiPvvHYQyu6N/
Comment:
If you watched the last LIVE Stream Link, you would KNOW we are using the Doubled Time Frame Cascade Rule to determine WHEN the current downward pressure will come to a close.
Comment:
That LAST "Live" Stream link IS RECORDED...