
**BTC vs. SPX: The Reset Before the Next Cycle?**
One of the more interesting charts in the market right now isn't BTC/USD.
It's **BTC/SPX**.
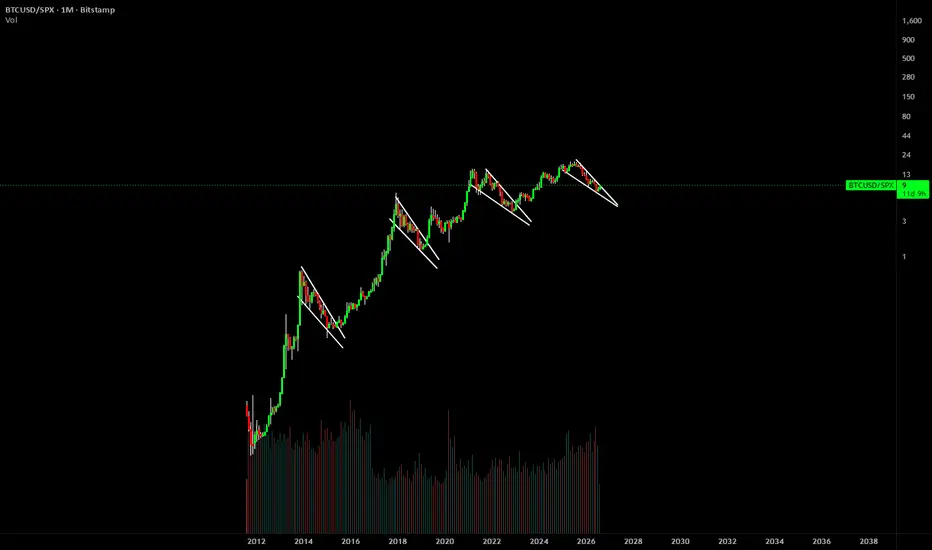
When Bitcoin is divided by the S&P 500, a repeating structure becomes much easier to see:
**Expansion → Falling Wedge / Reset → Breakout → Expansion**
And it has happened multiple times during this relative-strength advance.
Look at the sequence on the chart.
Each major push higher in BTC/SPX has been followed by a controlled downward-sloping consolidation. Instead of completely breaking the relative-strength trend, Bitcoin resets against equities, establishes another higher base, and eventually begins the next leg higher.
Now we're seeing a very similar structure developing again.
### Why BTC/SPX Matters
BTC/USD only tells us what Bitcoin is doing against the dollar.
BTC/SPX asks a different question:
**Is capital being rewarded more for holding Bitcoin or the broad U.S. equity market?**
When BTC/SPX trends higher, Bitcoin is outperforming the S&P 500.
That makes the current consolidation particularly interesting.
The ratio remains within the broader relative-strength advance, while another downward-sloping reset has formed near the highs.
If this structure resolves the same way the previous ones did, a breakout would suggest **Bitcoin is beginning another period of relative outperformance versus equities.**
### The Pattern I'm Watching
Previous sequence:
**BTC/SPX impulse higher
→ falling consolidation
→ breakout
→ higher high**
Then again:
**Impulse
→ reset
→ breakout
→ higher high**
And again.
Now:
**Impulse
→ reset
→ ?**
The question is whether the current structure becomes the next continuation.
A confirmed break above the descending trendline — particularly if followed by expansion in the ratio — would strengthen that thesis.
Failure to break out, or loss of the broader higher-low structure, would invalidate the immediate continuation setup.
### Bigger Picture
This is why periods where Bitcoin appears to be "doing nothing" can be deceptive.
Markets don't move vertically.
Strong trends repeatedly go through **expansion, consolidation, and re-expansion**.
BTC/SPX is currently testing whether this is simply another reset in Bitcoin's relative-strength cycle.
If history rhymes again, the next move may not just be Bitcoin moving higher.
It could represent **another rotation toward Bitcoin outperforming traditional equities.**
**BTC/SPX is the chart I'm watching for confirmation.**
*This analysis is for educational purposes only and is not financial advice. Past chart structures do not guarantee future results. Always conduct your own research and manage risk appropriately.*

YouTube: youtube.com/channel/UCO85FMvCQzxq5QBEOpERkRg
Linktree: linktr.ee/swingtradepros
Website: swingtradepros.com
Discord: discord.gg/swingtradepros
Linktree: linktr.ee/swingtradepros
Website: swingtradepros.com
Discord: discord.gg/swingtradepros
Disclaimer
The information and publications are not meant to be, and do not constitute, financial, investment, trading, or other types of advice or recommendations supplied or endorsed by TradingView. Read more in the Terms of Use.