
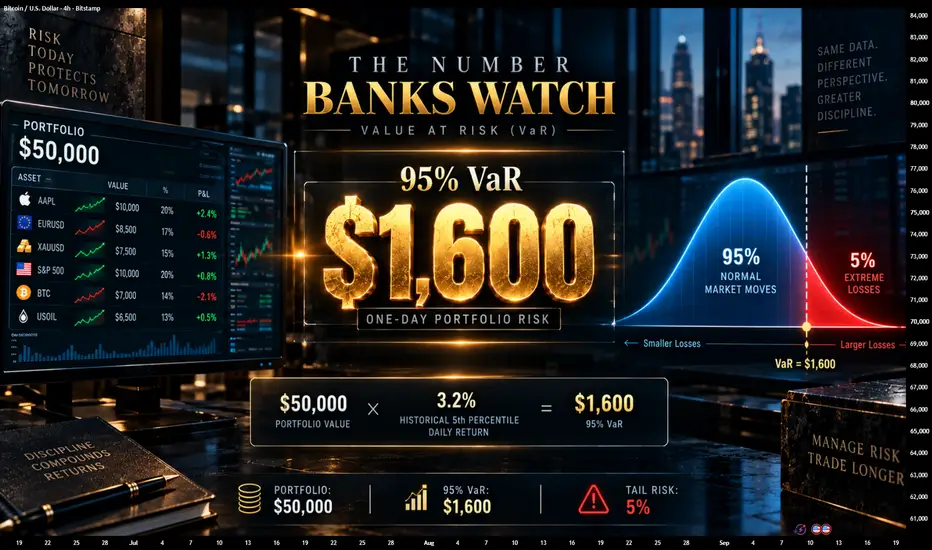
Almost every bank or hedge fund will calculate one specific number every day before the market opens. It tells them, with some confidence level, how much maximum damage they can theoretically expect to see for their positions by the end of the day or the week. This number is known as Value at Risk, or VaR, and banks and funds have used it for decades on their trading desks, while almost no retail trader has ever calculated it for themselves.
This article will explain what this number represents, how you can calculate a crude approximation for your own trading positions, and why understanding it is so important for the average retail trader.
What VaR actually tells you
Value at Risk answers the question "based on how my positions have performed so far, what is the maximum loss I could expect to see in a day/week with a given confidence level?"
The way it is usually phrased is "with 95% confidence, the loss will not exceed 5,000 dollars", etc. This does not mean that the loss cannot be larger than 5,000 dollars; it just means that the loss is expected to be larger than 5,000 dollars in only 5% of cases (on average, once every 20 days). This number is useful to have for setting risk limits for a portfolio and having a rough ballpark figure of how much money could potentially be lost in portfolios consisting of dozens or hundreds of positions. The more positions there are in a portfolio, the lower the Value at Risk will be for a given confidence level.
The simplest way to calculate it yourself
There are multiple approaches to calculating VaR, but the simplest method is the historical one and does not require any special statistical software.
Take the historical returns (daily returns) of either your portfolio or of a position you are interested in calculating VaR for and sort them from the worst to the best daily return. Pick the return that is at the 5th percentile (for 95% confidence) of the sorted list, and you have your daily Value at Risk. For example, if you are looking at a 1-year history of daily returns and there are 252 trading days in it, 5% of 252 is about 12.6, which would put the 95% VaR at the 13th worst daily return in the sorted list of daily returns.
If that worst daily return is -3.2%, the Value at Risk for your portfolio at 95% confidence is 3.2% of your portfolio value. With a 50,000-dollar portfolio, the VaR would be about 1,600 dollars.
What that number actually means
That 1,600 dollar number is telling you that based on the performance of your portfolio, on average, you could expect to see a day where the portfolio loses 1,600 dollars or more every 20 days, due to normal market volatility.
This is an incredibly useful number in the context of how much risk you are taking in your trading, as it is this number that could cause you to go broke if it happens on a day when you have an open trade that gets stopped out or liquidated at a loss.
The part that trips people up - VaR does NOT account for the worst-case scenario
This is the most important caveat about Value at Risk that you need to know, and is the reason why even banks and funds get tripped up by it. As mentioned above, the 95% VaR will have a value that represents the loss that is expected in 95% of scenarios, with the other 5% of scenarios having larger losses. The worst-case scenario is not represented by VaR, which is why during the 2008 crisis, several banks saw VaR breaches on multiple consecutive days, as the daily losses exceeded the VaR threshold.
This means that it is critical to use another risk assessment tool called stress testing in conjunction with VaR to make sure that the worst-case scenarios are not being ignored. In the banking/fund world, VaR is used for day-to-day risk assessment, while stress testing is used for special scenarios that are not covered by normal day-to-day market moves.
Why retail traders never calculate this
In general, most trading platforms do not provide VaR calculation as a feature. There is no little VaR icon on a trader's platform the way there is a profit and loss column. To calculate it, a trader would have to calculate their historical daily returns and sort them to find the 5th percentile, or use an Excel function that does it automatically. It is a bit more involved than simply looking at a P&L column, which is why most casual traders never bother.
There is also the mental hurdle of thinking about risk in terms of total portfolio loss on a bad day, as opposed to losses on an individual trade. Value at Risk is a measure of portfolio risk, and not a measure of risk for individual trades.
How to actually use this
Calculate a historical VaR for your portfolio as a whole, not individual positions. The risk for a portfolio of multiple positions being down x percent on a bad day is significantly higher than the risk of any single position being down x percent on a bad day.
You should recalculate this number periodically, or when there are large changes to your portfolio or when the market has seen significantly wider moves than usual in either direction. The Value at Risk number calculated from historical performance will always lag current market conditions, and so using old numbers will underestimate your risk.
Do not think of your VaR number as a hard limit that you will never exceed, but rather as a rough guideline of how bad things can potentially get. Extremely large moves will always occur more often than the VaR suggests.
Do a simple stress test for your portfolio or largest position in your portfolio by estimating what would happen to your account if your largest position dropped by 30-40% in a single day. This is a situation that your VaR number is likely to vastly underestimate.
My Conclusion
Banks do not calculate VaR because it tells them what the worst-case scenario is for their positions. They calculate it because it is a number that allows them to have a certain confidence level about how much risk they are taking in their positions every day. Most retail traders rarely think about risk in terms of how much their account could potentially lose on an average bad day instead of losses on individual trades. Understanding what this number means and how to calculate it for your own trading is invaluable, and it only takes an afternoon to calculate.
Thank you
VertexQore

Related publications
Disclaimer
The information and publications are not meant to be, and do not constitute, financial, investment, trading, or other types of advice or recommendations supplied or endorsed by TradingView. Read more in the Terms of Use.
Related publications
Disclaimer
The information and publications are not meant to be, and do not constitute, financial, investment, trading, or other types of advice or recommendations supplied or endorsed by TradingView. Read more in the Terms of Use.