
BTCUSD — Missed Entry & Price Action Educational Analysis
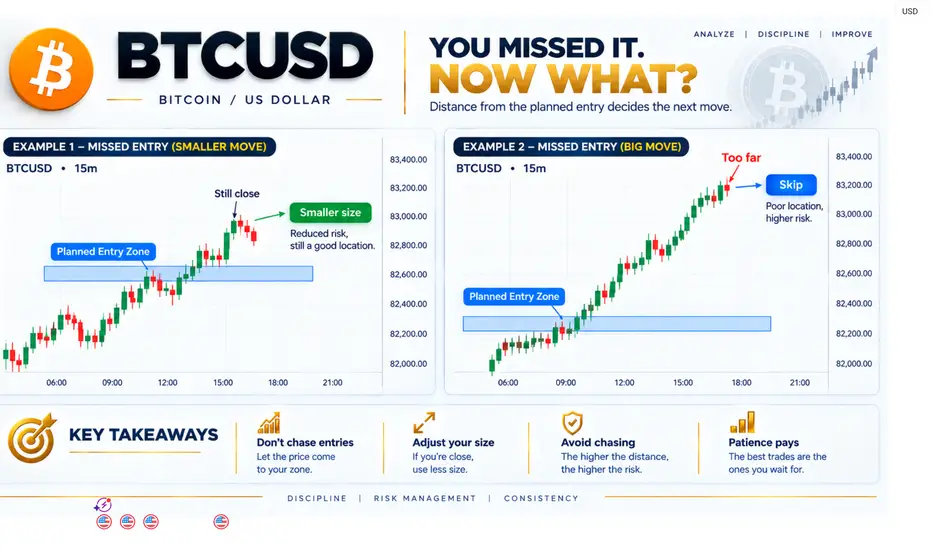
This chart explains an important trading lesson: missing an entry does not mean you should chase the market. Every candle provides information about buying pressure, selling pressure, rejection, momentum and market structure. The distance from the planned entry zone should always be considered before taking any new position.
Example 1 — Smaller Move / Still Close
The first example shows BTCUSD gradually moving upward from the planned entry zone. The initial candles are relatively small and mixed, showing that the market is still building momentum rather than making a strong directional move.
1. Initial Small Bullish Candles
Reason: Buyers are gradually entering the market, but the candle bodies remain relatively small. This suggests that bullish pressure is developing slowly and the market has not yet shown strong momentum.
2. Small Bearish Candle
Reason: Sellers temporarily push price lower, but the candle does not create a significant structural breakdown. This can represent short-term profit-taking rather than a confirmed bearish reversal.
3. Repeated Bullish Candles
Reason: Buyers begin closing candles progressively higher, showing increasing demand. When bullish candles start appearing more consistently, the probability of continued upward momentum can increase, but confirmation should still come from structure.
4. Planned Entry Zone
Reason: This is the predefined area where the original setup was expected to activate. Planning the entry beforehand helps prevent emotional decisions after price starts moving.
5. Rejection / Wick Around Entry
Reason: The wick shows that price attempted to move through the area but faced temporary opposing pressure. The reaction around the zone is important because it can show whether buyers or sellers are defending the level.
6. Bullish Break Above Entry Zone
Reason: Price begins closing above the planned zone, showing that buyers are gaining control. A confirmed close is generally more meaningful than entering simply because price briefly trades above the level.
7. Higher High
Reason: Price creates a new local high, confirming that the bullish structure is continuing. The sequence of higher highs and higher lows is important for understanding the current price action.
8. Still Close
Reason: Price has moved away from the original entry but is still relatively close to the planned area. The key lesson is not to increase risk simply because the entry was missed; if a setup is still considered valid, position size and remaining risk must be reassessed.
9. Small Red Candles Near the Top
Reason: These candles can represent short-term profit-taking or temporary selling pressure after the upward move. A few bearish candles alone do not confirm a reversal; their location and effect on market structure should be considered.
---
Example 2 — Big Move / Too Far
The second example shows what happens when price moves significantly away from the original planned entry. The market initially develops around the entry zone, but then momentum accelerates and creates a much larger move.
1. Initial Consolidation
Reason: Smaller candles around the planned zone indicate that buyers and sellers are temporarily balanced. This type of consolidation can occur before the market chooses a stronger direction.
2. First Strong Bullish Break
Reason: A stronger bullish candle pushes price away from the consolidation area, showing that buying pressure has increased. The important point is that the move is now developing away from the original entry.
3. Consecutive Bullish Candles
Reason: Several bullish candles closing higher demonstrate sustained buying momentum. However, increasing momentum does not automatically create a new entry because the distance from the original setup is also increasing.
4. Higher High + Higher Low Structure
Reason: The market continues forming higher highs and higher lows, indicating that the bullish structure remains intact. Traders should distinguish between trend direction and entry location—a bullish trend can still have a poor entry location.
5. Large Momentum Candle
Reason: A large bullish candle shows aggressive buying activity and strong momentum. Entering immediately after an extended candle can expose the trader to a larger pullback before the next continuation.
6. Small Pullback Candle
Reason: The smaller bearish candle represents temporary selling pressure or profit-taking. If price remains above important structure, it does not automatically invalidate the bullish move.
7. Continued Bullish Expansion
Reason: Price resumes upward movement and continues creating higher highs. At this stage, the trend may look strong, but the original planned entry is becoming increasingly distant.
8. Too Far
Reason: Price is now significantly away from the planned entry zone. The original risk-to-reward conditions may no longer be the same, so entering purely because price is moving strongly can create unnecessary risk.
9. Skip
Reason: The purpose of “Skip” is to avoid chasing an extended move. Waiting for a new setup, retracement, or fresh entry structure allows the trader to maintain a predefined risk plan instead of reacting emotionally to momentum.
---
Candle-by-Candle Learning Points
Small bullish candle:
Reason: Buyers are gradually gaining strength, but momentum is still developing.
Large bullish candle:
Reason: Strong buying pressure is present, but the candle can also increase the distance from the ideal entry.
Small bearish candle:
Reason: Temporary selling or profit-taking may be occurring; one candle alone does not confirm a reversal.
Large bearish candle:
Reason: Stronger selling pressure is visible and may indicate a meaningful change in momentum if supported by market structure.
Long upper wick:
Reason: Price moved higher but sellers pushed it back down, showing rejection from higher prices.
Long lower wick:
Reason: Sellers pushed price lower, but buyers recovered part of the move, showing rejection from lower prices.
Multiple higher closes:
Reason: Buyers are maintaining control and price is progressively accepting higher levels.
Consecutive bullish candles:
Reason: Momentum is strengthening, but the further price travels from the planned zone, the more important entry location becomes.
Small candles after strong momentum:
Reason: Price may be pausing or consolidating; patience is preferable to assuming either continuation or reversal without confirmation.
Price far from planned entry:
Reason: The original setup may no longer provide the same risk-to-reward conditions that existed at the planned zone.
---
Core Lesson
A missed trade does not need to be recovered immediately. Professional trading is not about entering every move; it is about waiting for conditions that fit the original plan.
The most important questions are:
Where was the planned entry?
How far has price moved from it?
What is each candle showing?
Has the market structure changed?
Is the remaining risk still acceptable?
Do not chase the candle. Understand the candle.
Educational purpose only. Proper risk management is essential.

This educational chart combines two important BTCUSD examples to help beginners understand market structure, support, liquidity, trendlines, CHoCH, PDH/PDL, premium zones, and risk management. The goal is not to predict every move, but to learn how to read what price is actually doing before considering an entry.
1. Major Support — Where Buyers React
The grey Major Support zone is an important area because price previously showed a strong reaction around this region.
When price approaches support, beginners should avoid assuming that price will automatically bounce. Instead, watch the candles carefully:
Bearish candles approaching support: sellers are still pushing price lower.
Long lower wicks: price moved lower but buyers stepped in and rejected those lower prices.
Small candles around support: selling pressure may be slowing and the market may be entering consolidation.
Bullish candle from support: buyers are beginning to show strength, but confirmation is still important.
The key lesson is: support is a zone, not an exact line.
2. Liquidity & Equal Lows
The EQL (Equal Lows) area shows similar lows around the same price region.
These areas can attract liquidity because multiple traders may place stops around obvious highs or lows. For beginners, the important point is not to automatically assume that liquidity will be taken; instead, observe how price reacts when it reaches the area.
3. CHoCH — Change of Character
The CHoCH marking is used to identify a potential change in short-term market structure.
Before the bullish move, price was producing weaker structure and moving lower. When price breaks an important previous swing point and begins establishing a different structure, it can provide an early indication that market behavior is changing.
Beginner rule:
Don't trade CHoCH alone. Combine it with support/resistance, candle confirmation, liquidity and overall structure.
4. Trendline Break
The descending trendline represents the previous bearish direction.
When price breaks above the trendline, it shows that the previous downward momentum is weakening. However, a simple trendline break is not automatically a buy signal.
Look for:
Trendline break → structure confirmation → pullback/retest → controlled risk.
5. Bullish Expansion
After the reaction from Major Support and the structural change, the second chart shows a strong bullish expansion.
The consecutive green candles indicate strong buying momentum, while the formation of higher highs and higher lows shows an improving bullish structure.
But remember:
Strong momentum ≠ automatic entry.
If price has already moved significantly, chasing the move can give a different risk-to-reward profile than entering closer to the original setup.
6. PDH — Previous Day High
The PDH level represents the previous day's high.
Previous highs are useful reference points because traders often monitor them as potential areas of liquidity, resistance, breakout or rejection.
When price approaches PDH, observe:
Candle size
Upper wicks
Closing strength
Whether price breaks and holds above the level
Whether price rejects the level
Don't assume that PDH must either break or reject—it needs to be read from the current price action.
7. PDL — Previous Day Low
The PDL represents the previous day's low.
It provides another important reference level for understanding where price is trading relative to the previous day's range.
For beginners, marking PDH and PDL before analyzing the session can make the chart much easier to understand.
8. Premium Zone
The Premium area represents the upper portion of the marked price range.
From a Smart Money Concepts perspective, traders often pay attention to whether price is relatively expensive or cheap within a defined range.
The important lesson is to avoid using the word premium as an automatic sell signal. Market structure and confirmation still matter.
9. Weak High
The Weak High marks a high that may not have strong structural confirmation behind it.
It can become an important reference point because price may later interact with that area again. For beginners, simply mark the high and observe what price does around it rather than predicting the outcome.
10. Risk Management
The green/red risk-reward box demonstrates an important part of the setup:
Entry → Stop Loss → Target
The stop-loss area defines where the trade idea would be considered invalid. The target area represents where the planned move could potentially reach.
Never choose the lot size first and then adjust the stop to fit it. Instead:
Plan the invalidation → calculate the risk → choose position size.
Beginner Checklist
Before taking a trade, ask:
1. What is the current market structure?
2. Where is the major support/resistance?
3. Where are the obvious highs and lows?
4. Has liquidity been taken?
5. Is there a confirmed CHoCH or structure break?
6. Is the trendline supporting the same idea?
7. Where are PDH and PDL?
8. Is price in a premium or discount area?
9. Where is the invalidation/SL?
10. Is the risk acceptable?
Core Lesson
Don't learn trading by memorizing one signal. Learn to connect the story of price.
Liquidity → Support/Resistance → Structure → CHoCH → Confirmation → Entry → Risk Management
The purpose of this chart is educational only. Market structure can change quickly, so every setup should be evaluated independently with proper risk management.

This chart explains an important trading lesson: missing an entry does not mean you should chase the market. Every candle provides information about buying pressure, selling pressure, rejection, momentum and market structure. The distance from the planned entry zone should always be considered before taking any new position.
Example 1 — Smaller Move / Still Close
The first example shows BTCUSD gradually moving upward from the planned entry zone. The initial candles are relatively small and mixed, showing that the market is still building momentum rather than making a strong directional move.
1. Initial Small Bullish Candles
Reason: Buyers are gradually entering the market, but the candle bodies remain relatively small. This suggests that bullish pressure is developing slowly and the market has not yet shown strong momentum.
2. Small Bearish Candle
Reason: Sellers temporarily push price lower, but the candle does not create a significant structural breakdown. This can represent short-term profit-taking rather than a confirmed bearish reversal.
3. Repeated Bullish Candles
Reason: Buyers begin closing candles progressively higher, showing increasing demand. When bullish candles start appearing more consistently, the probability of continued upward momentum can increase, but confirmation should still come from structure.
4. Planned Entry Zone
Reason: This is the predefined area where the original setup was expected to activate. Planning the entry beforehand helps prevent emotional decisions after price starts moving.
5. Rejection / Wick Around Entry
Reason: The wick shows that price attempted to move through the area but faced temporary opposing pressure. The reaction around the zone is important because it can show whether buyers or sellers are defending the level.
6. Bullish Break Above Entry Zone
Reason: Price begins closing above the planned zone, showing that buyers are gaining control. A confirmed close is generally more meaningful than entering simply because price briefly trades above the level.
7. Higher High
Reason: Price creates a new local high, confirming that the bullish structure is continuing. The sequence of higher highs and higher lows is important for understanding the current price action.
8. Still Close
Reason: Price has moved away from the original entry but is still relatively close to the planned area. The key lesson is not to increase risk simply because the entry was missed; if a setup is still considered valid, position size and remaining risk must be reassessed.
9. Small Red Candles Near the Top
Reason: These candles can represent short-term profit-taking or temporary selling pressure after the upward move. A few bearish candles alone do not confirm a reversal; their location and effect on market structure should be considered.
---
Example 2 — Big Move / Too Far
The second example shows what happens when price moves significantly away from the original planned entry. The market initially develops around the entry zone, but then momentum accelerates and creates a much larger move.
1. Initial Consolidation
Reason: Smaller candles around the planned zone indicate that buyers and sellers are temporarily balanced. This type of consolidation can occur before the market chooses a stronger direction.
2. First Strong Bullish Break
Reason: A stronger bullish candle pushes price away from the consolidation area, showing that buying pressure has increased. The important point is that the move is now developing away from the original entry.
3. Consecutive Bullish Candles
Reason: Several bullish candles closing higher demonstrate sustained buying momentum. However, increasing momentum does not automatically create a new entry because the distance from the original setup is also increasing.
4. Higher High + Higher Low Structure
Reason: The market continues forming higher highs and higher lows, indicating that the bullish structure remains intact. Traders should distinguish between trend direction and entry location—a bullish trend can still have a poor entry location.
5. Large Momentum Candle
Reason: A large bullish candle shows aggressive buying activity and strong momentum. Entering immediately after an extended candle can expose the trader to a larger pullback before the next continuation.
6. Small Pullback Candle
Reason: The smaller bearish candle represents temporary selling pressure or profit-taking. If price remains above important structure, it does not automatically invalidate the bullish move.
7. Continued Bullish Expansion
Reason: Price resumes upward movement and continues creating higher highs. At this stage, the trend may look strong, but the original planned entry is becoming increasingly distant.
8. Too Far
Reason: Price is now significantly away from the planned entry zone. The original risk-to-reward conditions may no longer be the same, so entering purely because price is moving strongly can create unnecessary risk.
9. Skip
Reason: The purpose of “Skip” is to avoid chasing an extended move. Waiting for a new setup, retracement, or fresh entry structure allows the trader to maintain a predefined risk plan instead of reacting emotionally to momentum.
---
Candle-by-Candle Learning Points
Small bullish candle:
Reason: Buyers are gradually gaining strength, but momentum is still developing.
Large bullish candle:
Reason: Strong buying pressure is present, but the candle can also increase the distance from the ideal entry.
Small bearish candle:
Reason: Temporary selling or profit-taking may be occurring; one candle alone does not confirm a reversal.
Large bearish candle:
Reason: Stronger selling pressure is visible and may indicate a meaningful change in momentum if supported by market structure.
Long upper wick:
Reason: Price moved higher but sellers pushed it back down, showing rejection from higher prices.
Long lower wick:
Reason: Sellers pushed price lower, but buyers recovered part of the move, showing rejection from lower prices.
Multiple higher closes:
Reason: Buyers are maintaining control and price is progressively accepting higher levels.
Consecutive bullish candles:
Reason: Momentum is strengthening, but the further price travels from the planned zone, the more important entry location becomes.
Small candles after strong momentum:
Reason: Price may be pausing or consolidating; patience is preferable to assuming either continuation or reversal without confirmation.
Price far from planned entry:
Reason: The original setup may no longer provide the same risk-to-reward conditions that existed at the planned zone.
---
Core Lesson
A missed trade does not need to be recovered immediately. Professional trading is not about entering every move; it is about waiting for conditions that fit the original plan.
The most important questions are:
Where was the planned entry?
How far has price moved from it?
What is each candle showing?
Has the market structure changed?
Is the remaining risk still acceptable?
Do not chase the candle. Understand the candle.
Educational purpose only. Proper risk management is essential.
This educational chart combines two important BTCUSD examples to help beginners understand market structure, support, liquidity, trendlines, CHoCH, PDH/PDL, premium zones, and risk management. The goal is not to predict every move, but to learn how to read what price is actually doing before considering an entry.
1. Major Support — Where Buyers React
The grey Major Support zone is an important area because price previously showed a strong reaction around this region.
When price approaches support, beginners should avoid assuming that price will automatically bounce. Instead, watch the candles carefully:
Bearish candles approaching support: sellers are still pushing price lower.
Long lower wicks: price moved lower but buyers stepped in and rejected those lower prices.
Small candles around support: selling pressure may be slowing and the market may be entering consolidation.
Bullish candle from support: buyers are beginning to show strength, but confirmation is still important.
The key lesson is: support is a zone, not an exact line.
2. Liquidity & Equal Lows
The EQL (Equal Lows) area shows similar lows around the same price region.
These areas can attract liquidity because multiple traders may place stops around obvious highs or lows. For beginners, the important point is not to automatically assume that liquidity will be taken; instead, observe how price reacts when it reaches the area.
3. CHoCH — Change of Character
The CHoCH marking is used to identify a potential change in short-term market structure.
Before the bullish move, price was producing weaker structure and moving lower. When price breaks an important previous swing point and begins establishing a different structure, it can provide an early indication that market behavior is changing.
Beginner rule:
Don't trade CHoCH alone. Combine it with support/resistance, candle confirmation, liquidity and overall structure.
4. Trendline Break
The descending trendline represents the previous bearish direction.
When price breaks above the trendline, it shows that the previous downward momentum is weakening. However, a simple trendline break is not automatically a buy signal.
Look for:
Trendline break → structure confirmation → pullback/retest → controlled risk.
5. Bullish Expansion
After the reaction from Major Support and the structural change, the second chart shows a strong bullish expansion.
The consecutive green candles indicate strong buying momentum, while the formation of higher highs and higher lows shows an improving bullish structure.
But remember:
Strong momentum ≠ automatic entry.
If price has already moved significantly, chasing the move can give a different risk-to-reward profile than entering closer to the original setup.
6. PDH — Previous Day High
The PDH level represents the previous day's high.
Previous highs are useful reference points because traders often monitor them as potential areas of liquidity, resistance, breakout or rejection.
When price approaches PDH, observe:
Candle size
Upper wicks
Closing strength
Whether price breaks and holds above the level
Whether price rejects the level
Don't assume that PDH must either break or reject—it needs to be read from the current price action.
7. PDL — Previous Day Low
The PDL represents the previous day's low.
It provides another important reference level for understanding where price is trading relative to the previous day's range.
For beginners, marking PDH and PDL before analyzing the session can make the chart much easier to understand.
8. Premium Zone
The Premium area represents the upper portion of the marked price range.
From a Smart Money Concepts perspective, traders often pay attention to whether price is relatively expensive or cheap within a defined range.
The important lesson is to avoid using the word premium as an automatic sell signal. Market structure and confirmation still matter.
9. Weak High
The Weak High marks a high that may not have strong structural confirmation behind it.
It can become an important reference point because price may later interact with that area again. For beginners, simply mark the high and observe what price does around it rather than predicting the outcome.
10. Risk Management
The green/red risk-reward box demonstrates an important part of the setup:
Entry → Stop Loss → Target
The stop-loss area defines where the trade idea would be considered invalid. The target area represents where the planned move could potentially reach.
Never choose the lot size first and then adjust the stop to fit it. Instead:
Plan the invalidation → calculate the risk → choose position size.
Beginner Checklist
Before taking a trade, ask:
1. What is the current market structure?
2. Where is the major support/resistance?
3. Where are the obvious highs and lows?
4. Has liquidity been taken?
5. Is there a confirmed CHoCH or structure break?
6. Is the trendline supporting the same idea?
7. Where are PDH and PDL?
8. Is price in a premium or discount area?
9. Where is the invalidation/SL?
10. Is the risk acceptable?
Core Lesson
Don't learn trading by memorizing one signal. Learn to connect the story of price.
Liquidity → Support/Resistance → Structure → CHoCH → Confirmation → Entry → Risk Management
The purpose of this chart is educational only. Market structure can change quickly, so every setup should be evaluated independently with proper risk management.

What You'll Get
Technical & fundamental analysis
Risk management tips to protect your capital
t.me/+MZQEnS08gLdlNjg8
JOIN MY TELEGRAM DAILY FREE SIGNAL
t.me/+_r_j8vfYwy03ODVk
Technical & fundamental analysis
Risk management tips to protect your capital
t.me/+MZQEnS08gLdlNjg8
JOIN MY TELEGRAM DAILY FREE SIGNAL
t.me/+_r_j8vfYwy03ODVk
Related publications
Disclaimer
The information and publications are not meant to be, and do not constitute, financial, investment, trading, or other types of advice or recommendations supplied or endorsed by TradingView. Read more in the Terms of Use.