Yes dammit YESSSSSSSSS, finally this market is alive again. Sorry, i had to get it out of my system :) Volume is a rare thing in crypto the past 6/8 months so i think we need to celebrate it when we do have it.
We have finally started the next leg up after i started this ABC analysis from the 3200 lows in December. There were some moments where the extreme low volume got me confused, doubtful and unsure at some moments. That's why having a game plan upfront helps you to stay on course, helps with filtering the noise as well, but most importantly, it helps you to stay objective and not getting caught up in the sentiment. Hang that picture up in your bedroom so you dream about it. Like i used to have that big poster of C.J. (Baywatch) 25 years ago, guys my age now what i mean ;).
Anyway, i posted a few messages in my channels and some here as well on Sunday, because i sensed something was going on. I just came back home that day from a nice Sunday walk and after i posted a few analysis like LTC' and ETH', the market started to move slowly. With all the frustrating and boring movements of the past month, i caught a lucky brake to be at home just when things started to move. Eventually all of those signs were the start of this rally. Those 10 days the market was moving sideways i was mostly bullish, since i was looking up again a day before the rally from 3400 started. But there were a few days where i was having a lot of doubt though. The extreme low volume was bugging me a lot and those Bart moves down we had a few times, it looked like the bears were in full control. First the 3580 was the low, then the 3550 became the low and like it was not frustrating enough the 3530 became the low. But luckily, the market was turning slowly and that curved blue line i posted in my previous analysis Yesterday, made it quite easy to look up again with more confidence. A big helping factor was Litecoin' the past month or so. Like ETH showed the way in Dec, LTC did it this time. Since i nailed the LTC analysis the past weeks, it made things a bit easier as well :)
Current situation: Volume is very good, big buying (no short squeezing) and some real conviction from the bulls again, just like the Dec rally. The bears were clearly pushing back but they simply lost the fight this time. Exactly how it should be with a "trend" change. It's not about indicators or whatever fancy tools, it's about buyers and sellers fighting and who eventually wins that fight. Indicators can help to spot who is in charge (over bought/sold, divergence etc.), not the other way around.
Short term: We will most likely see at least another move above today's high of 3920. For the coming days i think we will see a move towards 3950/4000 at least before making a bigger correction. We have room until 3720/3700 for a correction(the turning point between bull and bear i mentioned the past weeks), but ideally we stay above the 3780/3800.
Coming weeks: As i mentioned many times before, even in Dec, i won't be making any predictions to whether this move is just a correction up to simply resume the bear trend again or that we have a change in the trend. We should simply judge it while it happens. A very big clue will be the red zone on the left, if the 4600 the chances increase for a trend change. To feel more confident about it, i want to see it reach the yellow circle around 5200 (target of that very ugly inverse H&S). If we would see it happen within 2 weeks or so, it will be very likely that we are in an impulse wave and we could see another big wave up the coming months.
If the bulls fail and things slow down a lot between 4000 and 4400, it will be more likely that this whole move is simply a big ABC correction within the big bear trend. The coming days could give us a big clue for all of this, with a break of that thick red line, to confirm the higher low pattern.
To make things clear, with trend change, i don't mean the bear market is over. We need much more for that to happen. Until a few months ago that level was around 13K for me. Now it could be lower, maybe between 8K and 10K. But no use to thinking about that already, to reach those levels there has to be a real fundamental change first.
Please don't forget to like if you appreciate this :)
Previous analysis:


Comment:
My best guess of the stage we are in now, when comparing to the Dec rally.
Comment:
There is someone not happy with this upwards move, doing a market sell of 5 mill on Bitmex, while the market is going towards him. In other words, 90% sure this person is trying to stop the rally. Either trying to short it or desperately trying to hold it because his vault is still full with short positions.
Anyway, the chart above seems to be playing out already. Could be the high is set now, since some big player are holding it now. So chances are here we are going to see a bigger correction/consolidation now the coming 24 hours or so.
OI has been dropping as well, also a sign that there are people who have been taking profits already. Dropping OI usually means a (temp) high is closing in as well.
So a bit of guessing on the low time frame, all i can say to the day traders is one word: partial :)
Comment:
New ETH analysis:

Comment:
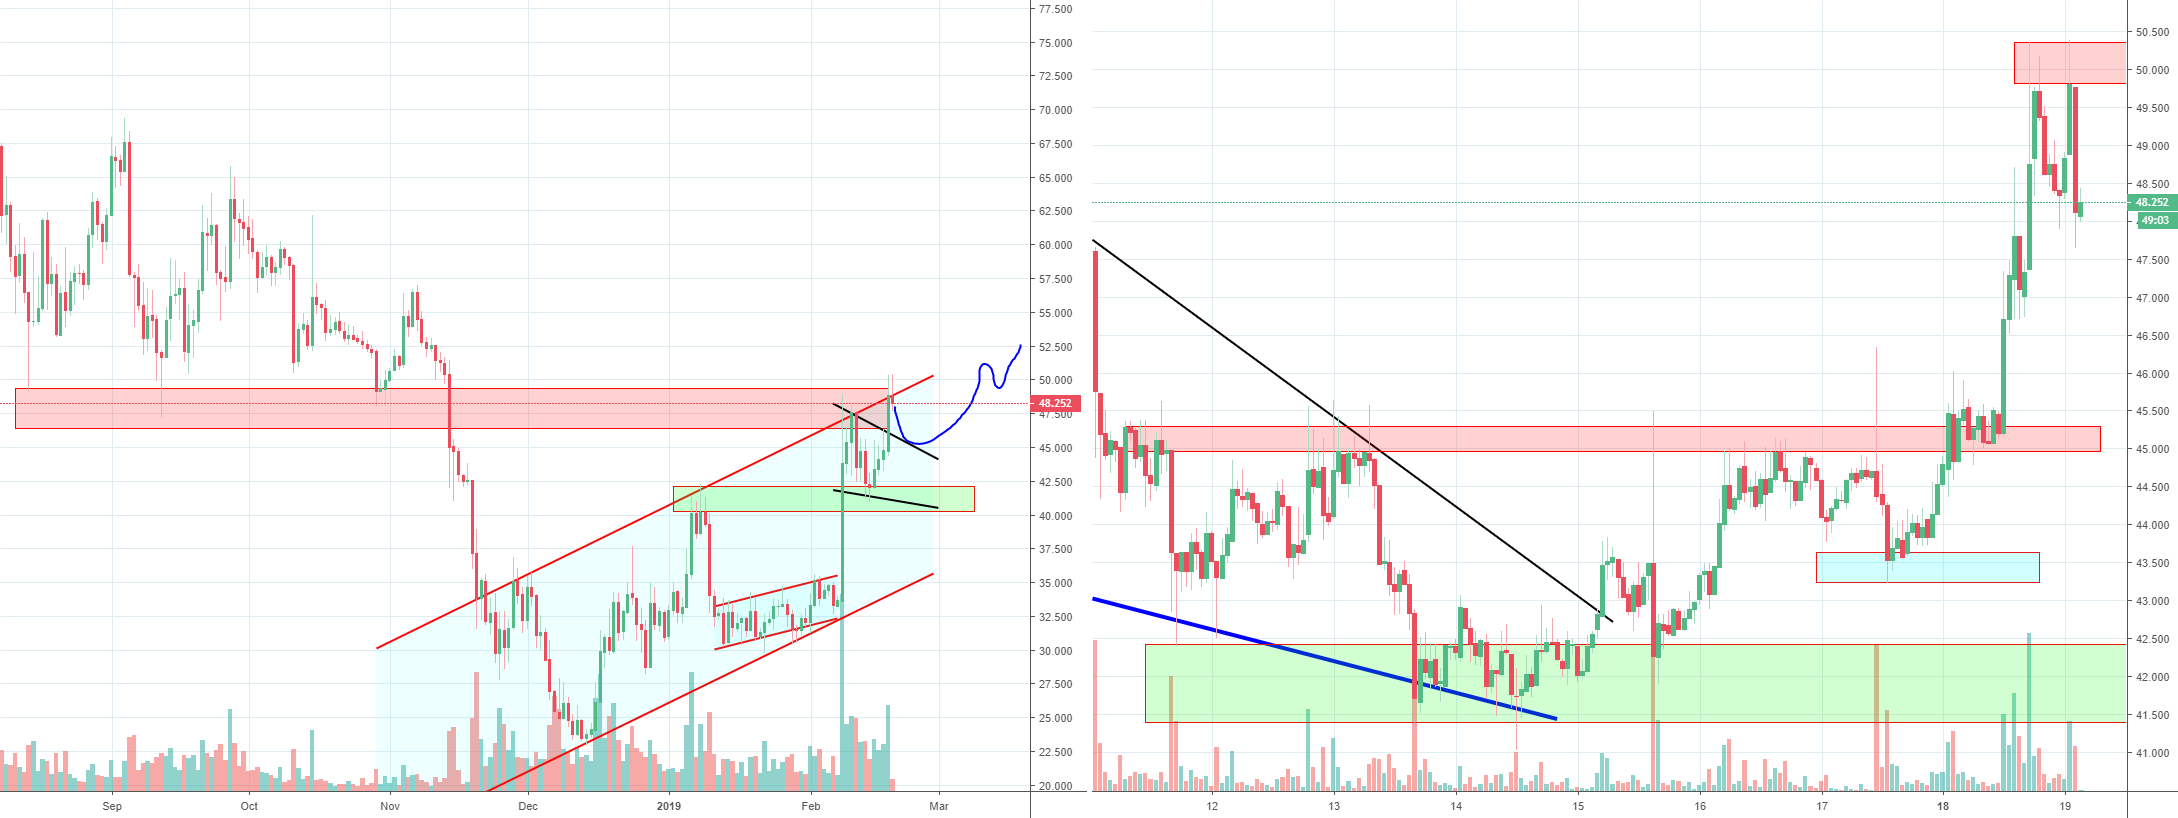
New LTC analysis:
Comment:
Looks like the 3840ish is the new support/foundation. So could be the low for now. So we could see another move up again. If that level breaks, I think the 3750ish will get tested
Comment:
New XLM analysis, looking very good now :)

Comment:
I posted this one in my channel a few hours ago, giving a small warning of some signs i saw today, indicating a drop could happen. Looks like it's trying to move up again, but i think it would be good to test the 3840/3780 zone again. Simply to see if this market is really up to something or not. In other words, to see if there are many buyers eager to get in if they see attractive prices around the 3800.
Comment:
Looks like the market does not want to drop and make a healthy correction. Even that small H&S never even broke the neckline, also suggesting it does not want to drop. Yesterday it seemed like it was going to drop and it did, but only to the 3860. Now it seems to be moving inside of a triangle, which will be a good indicator to see what the next step will be on the short term.
Bigger picture is still up, but short term can go both ways now. If it fails to break the lower high pattern, a drop will be more likely. That curved blue line can be a small first sign as well
Bigger picture is still up, but short term can go both ways now. If it fails to break the lower high pattern, a drop will be more likely. That curved blue line can be a small first sign as well
Comment:
It looks like some are trying to pump ETH and as if Bitcoin is really trying not to move up. So with each small ETH pump, BTC moves up only a little bit and staying below it's resistance. Buying is much more aggressive when looking at ETH, while volume at Bitcoin seems to be almost very low.
Anyway, it looks like something is about to happen. Either a move up from here, but probably if it doesn't happen withing like a few min up to half an hour (a guess), we could see a counter move.
Some big sell orders popping up on Bitmex trying to hold the price, but as usually their fake orders because as soon as buying gets close they go away and when buying slows down they appear again.
Comment:
Yesterday (12 hours ago) i showed some thing in my channel, since i did a bit more research, about who these spoofers prob were in this case. You can read it there if you want to see it. So that we saw a Bart move happen, is no surprise, since the volume dropped to like 35% of what it was the days before, making it easier again to make these moves. Anyway, it looks like we had that last wave up and prob have started the ABC correction.
I am already writing a new analysis, but because it takes time i just doing this quick update here
I am already writing a new analysis, but because it takes time i just doing this quick update here
Comment:
New Bitcoin analysis:

Want to support me? My affiliates:
partner.bybit.com/b/botje12
onelink.to/quantfury
Add invite code AFTER signing up, bonus up to $250: 4JU345F3
1 trade, 30 day wait, to claim bonus
www.kucoin.com/r/af/rMQN2A5
partner.bybit.com/b/botje12
onelink.to/quantfury
Add invite code AFTER signing up, bonus up to $250: 4JU345F3
1 trade, 30 day wait, to claim bonus
www.kucoin.com/r/af/rMQN2A5