
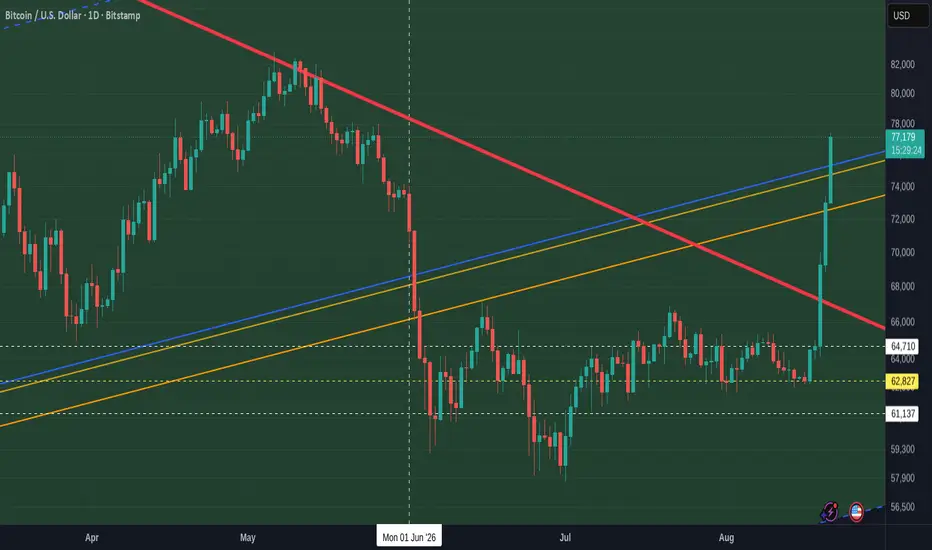
Yesterday, I talked about how PA was testing a very old and Strong area of Resistance.
The chart below shows you that these 2 lines have existed a Long time and usualy mark the Bear Floor.
The Arrow points to these 2 lines. See how previous Bears Hit these lines and went higher,,sometimes ranging but never dropping below.
Umtil this time.
We fell through this Bear,,,,,,,
So now, we back in Channel.
How much strength does BTC PA have left ?
The Charts are all DAILY timeframes
The RSI is way up high, rarely ranges in this area but can drop while PA Ranges
MACD is heading towards a possible line of resistance. And, YES, Trendlines work of indicators also
SOPR ( Spemt Ouput Profot Ratio) This ONCHAIN indicator shows us that losses are deminishing and so, as a result, confidence may well return to the Bitcoin Market
So, Lets look back at the Chart.
The idea of the push higher continueing as it is possibly flawed as PA is becoming oversbought on the 4 hour and Daily timeframes now. PA may return to the upper trend line and test it as Support.
PA could continue higher if the Bulls feel impatient as the weekly indicators are all oversold but this will involve a pause in this push higher
What is important to understand is that we have just seen the Strength of the Bulls...they are still there, waiting......And Bitcoin is BACK in its long Term channel and in the Lower realms of it...
The Room to push higher exists....
Happy Days

Nothing to be taken as Financial advice.
I will always say
"Only invest what you can afford to loose. When you are ready, take out your original investment. This way, it is only your profit that is at risk"
THAT is Financial advice
I will always say
"Only invest what you can afford to loose. When you are ready, take out your original investment. This way, it is only your profit that is at risk"
THAT is Financial advice
Disclaimer
The information and publications are not meant to be, and do not constitute, financial, investment, trading, or other types of advice or recommendations supplied or endorsed by TradingView. Read more in the Terms of Use.