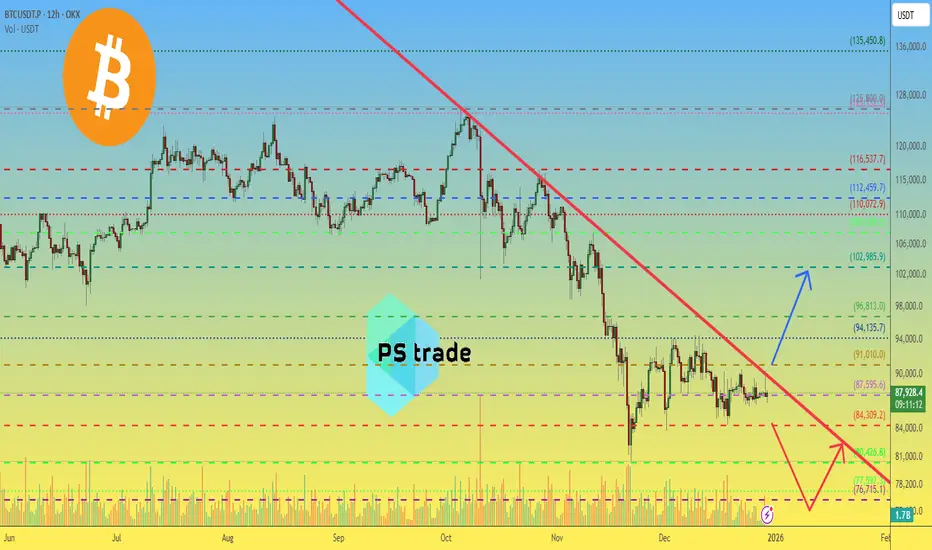
#Bitcoin remains in a compression phase between key structural levels.
A failed attempt to break the descending trendline resulted in a bearish 12H pin bar, increasing the probability of a short-term move toward $84,500.
Key
 BTCUSDT levels:
• Resistance: $91,000 → $94,000–95,000
• Support: $84,000–84,500
• Major downside target if support fails: $75,000–77,000
On the monthly timeframe, a sweep into the $75–77K zone in early January aligns with historical market behavior observed in early 2025-type structures.

Bullish continuation requires a clean break and acceptance above $91K, followed by short liquidation fuel above $94K.
Question for traders:
WillBTC resolve this range to the downside first, or can buyers reclaim control before year-end?
______________
◆ Follow us ❤️ for daily crypto insights & updates!
🚀 Don’t miss out on important market moves
🧠 DYOR | This is not financial advice, just thinking out loud
A failed attempt to break the descending trendline resulted in a bearish 12H pin bar, increasing the probability of a short-term move toward $84,500.
Key
BTCUSDT levels:• Resistance: $91,000 → $94,000–95,000
• Support: $84,000–84,500
• Major downside target if support fails: $75,000–77,000
On the monthly timeframe, a sweep into the $75–77K zone in early January aligns with historical market behavior observed in early 2025-type structures.
Bullish continuation requires a clean break and acceptance above $91K, followed by short liquidation fuel above $94K.
Question for traders:
Will
BTC resolve this range to the downside first, or can buyers reclaim control before year-end?______________
◆ Follow us ❤️ for daily crypto insights & updates!
🚀 Don’t miss out on important market moves
🧠 DYOR | This is not financial advice, just thinking out loud
Trade active
BTC price is attempting to break above a multi-month descending trendline.At the moment, the order book does not show significant sell-side resistance above current levels. This increases the probability of an acceleration phase if short positions begin to unwind.
Key technical conditions:
A confirmed 12H close above the trendline
Sustained price action above $87,500
If these conditions hold, the market may transition from consolidation into a directional move within the next few sessions.
Failure to hold above the trendline would likely extend the range-bound structure.
📌 What scenario do you consider more likely from here — continuation or rejection?

🎁 -20% for ALL trading fees at #OKX 👇
okx.com/join/20PSTRADE
🔥 V-I-P 👉 t.me/P_S_trade_menue_bot
🔵 Telegram 👉 t.me/pstrade_eng
🤖 Trading Bot 👉 copytrading.space/en/
📞 t.me/P_S_trades 📝
okx.com/join/20PSTRADE
🔥 V-I-P 👉 t.me/P_S_trade_menue_bot
🔵 Telegram 👉 t.me/pstrade_eng
🤖 Trading Bot 👉 copytrading.space/en/
📞 t.me/P_S_trades 📝
Related publications
Disclaimer
The information and publications are not meant to be, and do not constitute, financial, investment, trading, or other types of advice or recommendations supplied or endorsed by TradingView. Read more in the Terms of Use.