Bitcoin(
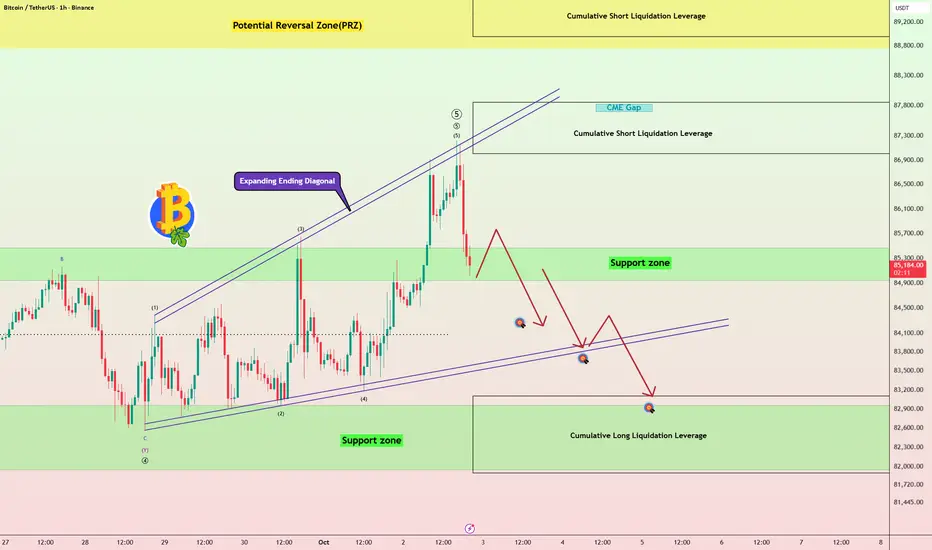
 BTCUSDT) has started to decline with strong bearish momentum and is now attempting to break below the Support Zone($84,940-$85,460).
The current structure suggests that selling pressure is increasing, while USDT Dominance% is also supporting the bearish scenario.
Can Bitcoin hold this Support Zone, or is a deeper correction toward $83,000 beginning?
Technical Analysis
From an Elliott Wave perspective, Bitcoin appears to have completed Primary Wave 5 through an Expanding Ending Diagonal.
From a classical technical analysis perspective, this structure also resembles an Ascending Broadening Wedge Pattern, which can signal weakening bullish momentum near the end of an uptrend.
💡 Educational Note: An Ending Diagonal often appears near the final stage of an Elliott Wave impulse and can signal trend exhaustion, especially when price breaks below its lower boundary.
Considering the current structure in USDT Dominance%, I expect Bitcoin to break below the Support Zone and decline at least toward the key trading level of $84,000.
However, weekend trading volume is typically lower, which could reduce the probability of an aggressive sell-off in the short term.
If bearish momentum continues into next week, BTC could extend its decline toward $83,000 and potentially the Cumulative Long Liquidation Leverage.
Trade Setup
First Take Profit(TP): $84,240
Second Take Profit(TP): $83,840
Third Take Profit(TP): $83,120
Stop Loss(SL): $87,000(Worst)
Key Trading Level: $84,000
Cumulative Short Liquidation Leverage: $87,000-$87,840
Cumulative Short Liquidation Leverage: $88,950-$90,000
Potential Reversal Zone(PRZ): $88,760-$91,870
Cumulative Long Liquidation Leverage: $81,900-$83,100
Upper CME Gap: $87,825-$87,700
Which level do you think Bitcoin will reach first?
🔴 $83,120
🟢 $87,000
📌 Bitcoin Analysis(BTCUSDT), 1-hour time frame.
🛑 Always use proper risk management and set a Stop Loss(SL) for every position.
🚀 If this analysis helps your trading plan, a BOOST would help more traders discover it.
BTCUSDT) has started to decline with strong bearish momentum and is now attempting to break below the Support Zone($84,940-$85,460).The current structure suggests that selling pressure is increasing, while USDT Dominance% is also supporting the bearish scenario.
Can Bitcoin hold this Support Zone, or is a deeper correction toward $83,000 beginning?
Technical Analysis
From an Elliott Wave perspective, Bitcoin appears to have completed Primary Wave 5 through an Expanding Ending Diagonal.
From a classical technical analysis perspective, this structure also resembles an Ascending Broadening Wedge Pattern, which can signal weakening bullish momentum near the end of an uptrend.
💡 Educational Note: An Ending Diagonal often appears near the final stage of an Elliott Wave impulse and can signal trend exhaustion, especially when price breaks below its lower boundary.
Considering the current structure in USDT Dominance%, I expect Bitcoin to break below the Support Zone and decline at least toward the key trading level of $84,000.
However, weekend trading volume is typically lower, which could reduce the probability of an aggressive sell-off in the short term.
If bearish momentum continues into next week, BTC could extend its decline toward $83,000 and potentially the Cumulative Long Liquidation Leverage.
Trade Setup
First Take Profit(TP): $84,240
Second Take Profit(TP): $83,840
Third Take Profit(TP): $83,120
Stop Loss(SL): $87,000(Worst)
Key Trading Level: $84,000
Cumulative Short Liquidation Leverage: $87,000-$87,840
Cumulative Short Liquidation Leverage: $88,950-$90,000
Potential Reversal Zone(PRZ): $88,760-$91,870
Cumulative Long Liquidation Leverage: $81,900-$83,100
Upper CME Gap: $87,825-$87,700
Which level do you think Bitcoin will reach first?
🔴 $83,120
🟢 $87,000
📌 Bitcoin Analysis(BTCUSDT), 1-hour time frame.
🛑 Always use proper risk management and set a Stop Loss(SL) for every position.
🚀 If this analysis helps your trading plan, a BOOST would help more traders discover it.
Order cancelled
Although Bitcoin successfully reached the first and second targets from the previous analysis, the overall price action did not develop according to the expected analytical scenario.For this reason, I am officially cancelling this analysis.
I’ll share a new Bitcoin analysis with you soon based on the latest market structure.
Transparency with my community has always been very important to me. I will always report every outcome clearly, including when a scenario is invalidated or when a Stop Loss (SL) is triggered.

🎁 Free Real VIP Forex and Crypto Signals. Please visit:
🔗 t.me/ProTrader_365
🔗 t.me/ProTrader_365
Related publications
Disclaimer
The information and publications are not meant to be, and do not constitute, financial, investment, trading, or other types of advice or recommendations supplied or endorsed by TradingView. Read more in the Terms of Use.