Welcome to My Analysis.
Now, let’s break down today’s Bitcoin structure.
On the daily timeframe, the structure remains clearly bearish.
Price is still trading below broken structures and under several major resistance levels.
After the strong drop, Bitcoin is now in a corrective phase within a downtrend.
Price is currently ranging between the two key levels:
83,900 – 93,700
From a price-action perspective:
Candles have formed a Lower High
Price still does not have the strength to create a Higher High
→ This confirms ongoing weakness.
A Demand Zone (red box) has formed around 83–84K, which caused the previous strong recovery.
For now, price is trapped between the descending dynamic trendline and the 84K support.
Volume — the most important factor for me
Low volume at the bottom → indicates uncertainty and lack of decision-making
No strong reversal volume yet
→ Buyers are not showing real commitment.
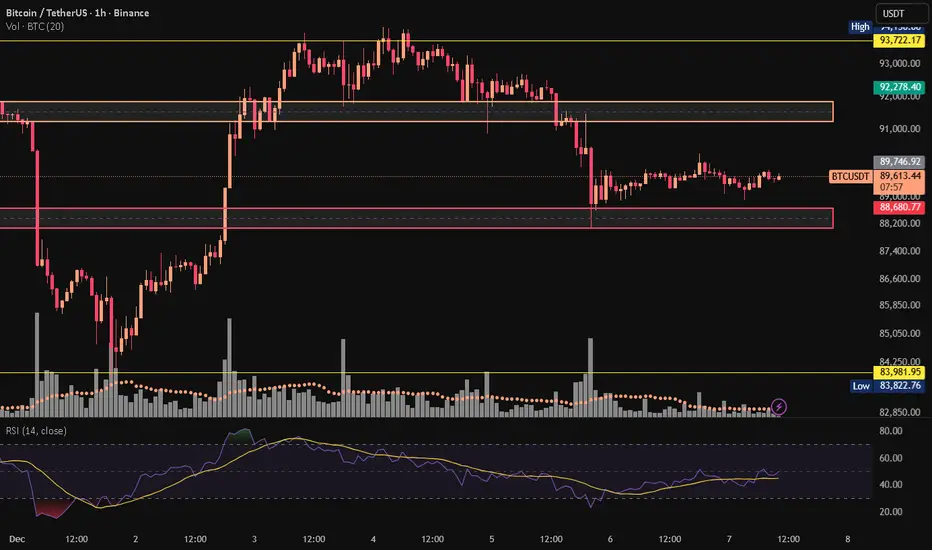
What’s happening on the 1H timeframe?
There are two major zones:
🔴 Supply Zone — 91,800 to 92,300
This is the top of the previous range
Price entered it multiple times but got rejected
Last entry → sellers immediately took control → drop to the low
Key signal:
Each time price enters this box, we see many upper wicks and rejections
Volume does not increase → meaning no strong buyers attempting a breakout
Result: Range and rejection
🟢 Demand Zone — 88,250 to 88,700
This zone has been extremely clean on the 1H:
First touch → strong reaction + fast rebound
Volume spiked exactly at the touch → showing real buyers
Candles have strong lower wicks
Price has revisited the zone several times without breaking it
Key signal:
As long as this zone holds,
the short-term trend = bearish range with strong support.
What does volume tell us?
🔸 Volume on the drops → high
→ Sellers were serious, intentional.
🔸 Volume during pullbacks → low
→ This confirms the move is corrective, buyer strength is weak,
and continuation of the downtrend is more likely.
🔸 Volume increased inside the demand zone
This is the most important signal of the entire chart:
When price touched 88,300–88,700,
a candle printed with above-average volume.
→ This confirms the demand zone has real buyer interest.
👈 So for now, this bottom is defendable.
Current Market Structure Summary
🔵 Higher TF (Daily): Bearish
🟠 Mid TF (4H–1H): Bearish range
🟢 Low TF (1H): Range with slight bearish bias
Meaning:
Primary trend → Bearish
Current structure → Range-bound
Entry triggers → Breakout of the range
Key Levels That Determine the Next Move
If 88,250 breaks:
Bearish continuation
Target → 83,900
If 92,300 breaks:
Range ends
Structure shifts bullish on higher timeframes
Targets :
93,700
100,565
⚠️ Risk Alert ⚠️
Futures are not beginner-friendly. These triggers require solid experience.
Before using them, study risk management and practice with the learning content here.
Now, let’s break down today’s Bitcoin structure.
On the daily timeframe, the structure remains clearly bearish.
Price is still trading below broken structures and under several major resistance levels.
After the strong drop, Bitcoin is now in a corrective phase within a downtrend.
Price is currently ranging between the two key levels:
83,900 – 93,700
From a price-action perspective:
Candles have formed a Lower High
Price still does not have the strength to create a Higher High
→ This confirms ongoing weakness.
A Demand Zone (red box) has formed around 83–84K, which caused the previous strong recovery.
For now, price is trapped between the descending dynamic trendline and the 84K support.
Volume — the most important factor for me
Low volume at the bottom → indicates uncertainty and lack of decision-making
No strong reversal volume yet
→ Buyers are not showing real commitment.
What’s happening on the 1H timeframe?
There are two major zones:
🔴 Supply Zone — 91,800 to 92,300
This is the top of the previous range
Price entered it multiple times but got rejected
Last entry → sellers immediately took control → drop to the low
Key signal:
Each time price enters this box, we see many upper wicks and rejections
Volume does not increase → meaning no strong buyers attempting a breakout
Result: Range and rejection
🟢 Demand Zone — 88,250 to 88,700
This zone has been extremely clean on the 1H:
First touch → strong reaction + fast rebound
Volume spiked exactly at the touch → showing real buyers
Candles have strong lower wicks
Price has revisited the zone several times without breaking it
Key signal:
As long as this zone holds,
the short-term trend = bearish range with strong support.
What does volume tell us?
🔸 Volume on the drops → high
→ Sellers were serious, intentional.
🔸 Volume during pullbacks → low
→ This confirms the move is corrective, buyer strength is weak,
and continuation of the downtrend is more likely.
🔸 Volume increased inside the demand zone
This is the most important signal of the entire chart:
When price touched 88,300–88,700,
a candle printed with above-average volume.
→ This confirms the demand zone has real buyer interest.
👈 So for now, this bottom is defendable.
Current Market Structure Summary
🔵 Higher TF (Daily): Bearish
🟠 Mid TF (4H–1H): Bearish range
🟢 Low TF (1H): Range with slight bearish bias
Meaning:
Primary trend → Bearish
Current structure → Range-bound
Entry triggers → Breakout of the range
Key Levels That Determine the Next Move
If 88,250 breaks:
Bearish continuation
Target → 83,900
If 92,300 breaks:
Range ends
Structure shifts bullish on higher timeframes
Targets :
93,700
100,565
⚠️ Risk Alert ⚠️
Futures are not beginner-friendly. These triggers require solid experience.
Before using them, study risk management and practice with the learning content here.
Disclaimer
The information and publications are not meant to be, and do not constitute, financial, investment, trading, or other types of advice or recommendations supplied or endorsed by TradingView. Read more in the Terms of Use.
Disclaimer
The information and publications are not meant to be, and do not constitute, financial, investment, trading, or other types of advice or recommendations supplied or endorsed by TradingView. Read more in the Terms of Use.