Hey TradingView community,
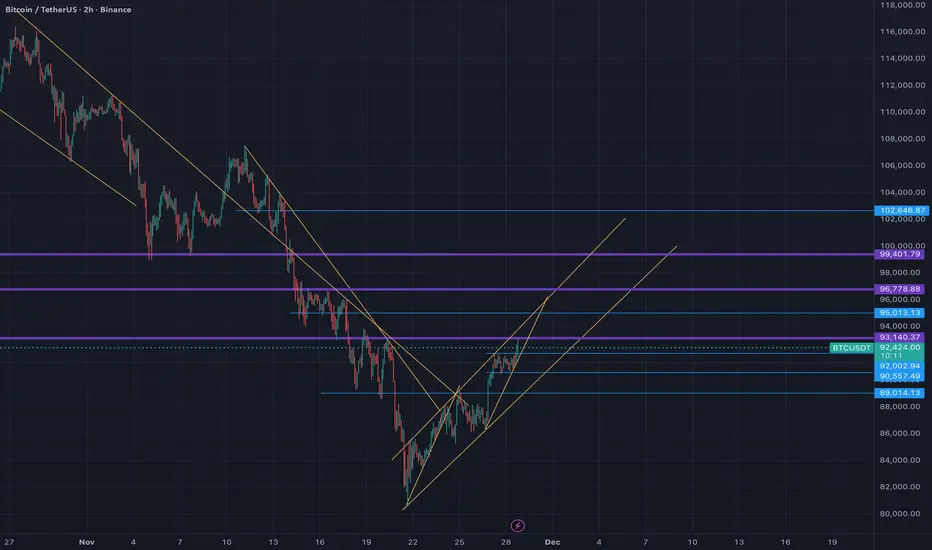
I’ve been closely monitoring Bitcoin’s price action amid this volatile November, and the 2H chart is painting an intriguing picture. After a sharp correction from October’s all-time highs above $126,000, BTC has been grinding lower, but it’s now forming a classic falling wedge pattern – a setup that’s often a precursor to bullish reversals in downtrends.    Check out my screenshot below for the details.
Key Observations from the Chart:
• The Pattern: We’ve got a descending resistance line connecting the lower highs since mid-November, paired with an ascending support line from the recent lows around $88,000-$90,000. This compression is typical of a falling wedge, where selling pressure diminishes, setting the stage for an upside breakout. If it holds, we could see a snap higher, similar to how these patterns resolved in past cycles.  
• Support and Resistance Levels:
• Strong support cluster at $92,000-$92,500 (current price action bouncing here) and lower at $89,000-$90,000, which has acted as a demand zone multiple times this month. 
• Overhead resistance at $96,000-$97,000 (prior highs), with a breakout potentially targeting $100,000-$104,000 based on the wedge’s measured move. On the flip side, a breakdown below $89,000 could open the door to $80,000 or even lower, as some analysts warn of deeper corrections.   
• Momentum Indicators: Volume appears to be drying up in the wedge, which is bullish, and RSI is hovering near oversold levels (around 30-40 on higher TFs), hinting at a potential rebound. No major divergences yet, but watch for one on the next leg down.
Market Context:
November 2025 has been a bloodbath for Bitcoin, with a 33% drop from peaks amid overleveraged longs getting flushed and broader macro pressures.  However, on-chain data shows accumulation by whales, and BlackRock’s ETF flows are turning positive again, suggesting the selling might be exhausting.  Sentiment is numb – perfect for a contrarian setup. Interestingly, ETH/BTC is also breaking out of its own multi-month wedge, which could signal altcoin strength if BTC stabilizes.  
Trading Idea:
• Bullish Scenario: Long on a confirmed breakout above the upper trendline (~$94,000) with stops below $92,000. Targets: $97,000 (short-term), $105,000+ (extended). 
• Bearish Scenario: If support cracks, short toward $85,000-$88,000, but I’d wait for confirmation to avoid whipsaws.
• Risk Management: Always use 1-2% risk per trade. Volatility is high, so position size accordingly. This isn’t financial advice – DYOR!
What do you think, bulls or bears in control? Drop your thoughts below. Let’s discuss!
#BTC #Bitcoin #Crypto #TechnicalAnalysis #FallingWedge #Trading
Disclaimer
The information and publications are not meant to be, and do not constitute, financial, investment, trading, or other types of advice or recommendations supplied or endorsed by TradingView. Read more in the Terms of Use.
Disclaimer
The information and publications are not meant to be, and do not constitute, financial, investment, trading, or other types of advice or recommendations supplied or endorsed by TradingView. Read more in the Terms of Use.