
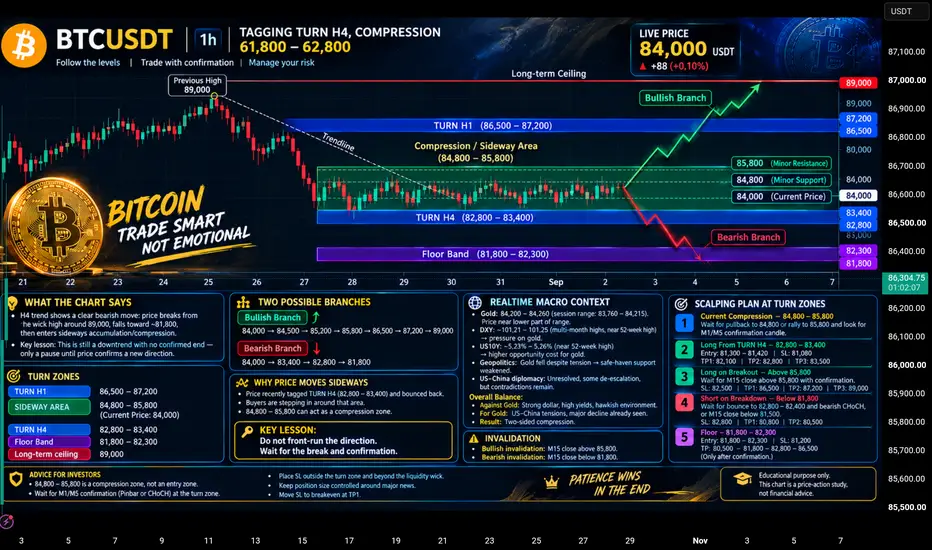
BTCUSD — THE 84K DECISION ZONE | Compression, Liquidity & The Next Big Move
BTCUSD | Price Action • Market Structure • Liquidity • Breakout Map
Bitcoin is currently around the 84,000 area, where price is showing a developing battle between buyers and sellers. Instead of forcing a bullish or bearish prediction, this analysis focuses on the key reaction zones, compression structure, liquidity, breakout confirmation and risk management that can help traders understand what BTC is actually doing.
The most important concept on this chart is simple:
> Price can move in either direction. The job is not to predict it — the job is to wait for confirmation.
---
01 — THE 84K MARKET STRUCTURE
BTCUSD is currently trading around 84K, positioned inside an important price area where the market can continue consolidating before a larger expansion.
When price remains between clearly defined support and resistance, the market can create:
Multiple tests of the same levels
False breakouts
Liquidity sweeps
Short-term CHoCHs
Strong reactions from support
Rejections from resistance
This is why entering simply because BTC moves a few hundred dollars in one direction can create unnecessary risk.
First identify the range. Then wait for the market to show its hand.
---
02 — KEY BTCUSD ZONES
🔴 UPPER TURN ZONE — 85,500–86,500
This is the first major resistance/reference area above the current price.
If BTC reaches this region, watch how the candles behave.
A strong rejection can bring price back toward the compression zone.
A confirmed breakout and successful retest can instead indicate that buyers are gaining control.
The level itself is not the signal — the reaction is the signal.
---
🟡 COMPRESSION ZONE — 83,000–85,500
This is the main area of interest around the current market.
BTC can continue moving sideways inside this region while buyers and sellers compete for control.
The middle of a range can produce low-quality entries because price may move in both directions before choosing a side.
Educational rule:
> Compression = patience.
Breakout + confirmation = opportunity to reassess.
---
⚪ CURRENT PRICE — 84,000
BTC is currently sitting inside the compression structure.
This means the market has not yet provided enough information to confidently assume a major directional continuation from this level alone.
Instead of asking:
“Will BTC go up or down?”
Ask:
“Which level will BTC break and successfully hold?”
That question keeps the analysis focused on observable price action.
---
🟢 LOWER TURN ZONE — 82,000–83,000
This area becomes important if BTC moves lower.
If price reaches this zone, watch for:
Lower-wick rejection
Bullish CHoCH
Higher-low formation
Strong bullish close
Retest confirmation
A reaction from the zone can provide more information than simply buying because price touched support.
---
🔵 MAJOR FLOOR — 80,000–81,000
This is the deeper support/reference region.
If the 82K–83K structure fails, this area becomes important for the next potential reaction.
However, even a major support zone should not be treated as a guaranteed reversal point.
Wait for price action.
---
03 — BULLISH BREAKOUT MAP
If BTC successfully breaks above the upper compression and confirms the move, the next areas can become relevant.
Potential Structure
84K → 85.5K → 86.5K → 88K
But the important part is how the breakout happens.
A stronger confirmation sequence would look like:
Breakout → Candle Close → Retest → Bullish Reaction → Continuation
If BTC suddenly produces a large bullish candle and becomes heavily extended, entering at the top of the move can create a less favorable location.
Strong momentum does not automatically mean a good entry.
---
04 — BEARISH BREAKDOWN MAP
If BTC loses the lower structure and confirms below the relevant support, the downside zones become important.
Potential Structure
84K → 83K → 82K → 80–81K
Again, one wick below support is not enough to automatically confirm a breakdown.
A stronger bearish sequence would be:
Breakdown → Close → Retest → Bearish CHoCH → Continuation
If price falls aggressively into the major floor, chasing the move can also become risky.
---
05 — LIQUIDITY: WHAT TO WATCH
Before taking any setup, identify obvious highs and lows.
Previous highs can become areas where liquidity is concentrated.
Previous lows can also attract price.
A common mistake among beginners is entering immediately when price approaches an obvious level.
Instead, watch what happens after the level is touched.
For example:
Liquidity sweep → Rejection → CHoCH → Retest
can provide much more information than simply:
Price touched support → Buy.
---
06 — HOW TO READ THE CANDLES
Small Green Candles
Gradual buying pressure is developing, but momentum is not necessarily strong yet.
Large Green Candle
Strong buying pressure is visible, but entering immediately afterward may mean chasing an already extended move.
Small Red Candle
Could represent temporary profit-taking or short-term selling. It does not automatically confirm a reversal.
Large Red Candle
Shows stronger selling pressure and may indicate a structural change if confirmed by surrounding price action.
Long Upper Wick
Price moved higher but sellers pushed it back down, showing rejection from higher prices.
Long Lower Wick
Price moved lower but buyers recovered part of the move, showing rejection from lower prices.
Higher High
Buyers have pushed price above a previous local high.
Higher Low
Buyers are defending a higher area, helping establish bullish short-term structure.
Lower High
Selling pressure is preventing price from creating a new high.
Lower Low
Price has broken below a previous low, showing increasing bearish structure.
---
07 — BREAKOUT VS FALSE BREAKOUT
Not every breakout deserves an immediate entry.
A candle can temporarily move above resistance and then close back below it.
That is why confirmation matters.
Stronger Process
Resistance break
↓
Candle closes above
↓
Price retests the level
↓
Level holds
↓
Bullish structure confirms
The same logic applies to bearish breakdowns.
---
08 — THE RETEST
A retest can help traders distinguish between a genuine structural change and a temporary price spike.
For example:
85.5K resistance breaks
Price moves higher.
Then price returns toward the broken level.
If buyers defend that level and price reacts upward again, the market is showing acceptance above the previous resistance.
The important point is not to assume every breakout must retest perfectly.
The market can also continue without giving a clean retest.
That is why traders should never force a setup that isn't there.
---
09 — RISK MANAGEMENT
A professional chart is incomplete without risk management.
Before entering, define:
Entry → Invalidation → Stop Loss → Position Size → Target
Do not choose your lot size first and then move the stop loss to fit the position.
Instead:
Define where the idea becomes invalid.
Then calculate how much you are willing to risk.
Then determine the appropriate position size.
This keeps the trade based on the market structure rather than emotion.
---
10 — BEGINNER CHECKLIST
Before taking a BTCUSD setup, ask:
1. Where is BTC currently trading?
2. Is price inside a range or a trend?
3. Where are the major support zones?
4. Where are the major resistance zones?
5. Where is the obvious liquidity?
6. Has liquidity already been taken?
7. Did CHoCH occur?
8. Did price actually close beyond the level?
9. Was there a retest?
10. Where is my invalidation?
11. Is my risk controlled?
12. Am I entering because of confirmation or because I fear missing the move?
---
11 — THE BIGGEST MISTAKE: CHASING BTC
When Bitcoin starts moving quickly, traders often feel that they must enter immediately.
That creates emotional decisions.
A missed entry does not mean you need to enter at a worse price.
A trade that has already moved significantly away from your planned area may no longer offer the same risk-to-reward conditions.
Missing one move is better than forcing a low-quality setup.
---
12 — THE 84K DECISION FRAMEWORK
Above 85.5K–86.5K
Watch for confirmed bullish structure and potential continuation.
Inside 83K–85.5K
Treat the area as compression and wait for confirmation.
Below 82K–83K
Watch for bearish structure and potential continuation toward the deeper floor.
Around 80K–81K
Watch for a reaction and confirmation rather than blindly assuming a reversal.
---
FINAL MARKET LESSON
Bitcoin does not need to be predicted candle by candle.
The strongest habit a beginner can develop is learning to wait for price to confirm the idea.
Mark the zone.
Wait for the reaction.
Read the structure.
Confirm the breakout or breakdown.
Define invalidation.
Control the risk.
Then make the decision.
Remember:
> Don't chase the candle. Read the structure.
Don't predict the breakout. Confirm it.
Don't force the middle of the range. Wait for the edge.
Risk management comes before prediction.
Educational content only. This analysis is for learning price action, market structure, liquidity and risk management. It is not financial advice.

What You'll Get
Technical & fundamental analysis
Risk management tips to protect your capital
t.me/+MZQEnS08gLdlNjg8
JOIN MY TELEGRAM DAILY FREE SIGNAL
t.me/+_r_j8vfYwy03ODVk
Technical & fundamental analysis
Risk management tips to protect your capital
t.me/+MZQEnS08gLdlNjg8
JOIN MY TELEGRAM DAILY FREE SIGNAL
t.me/+_r_j8vfYwy03ODVk
Related publications
Disclaimer
The information and publications are not meant to be, and do not constitute, financial, investment, trading, or other types of advice or recommendations supplied or endorsed by TradingView. Read more in the Terms of Use.