
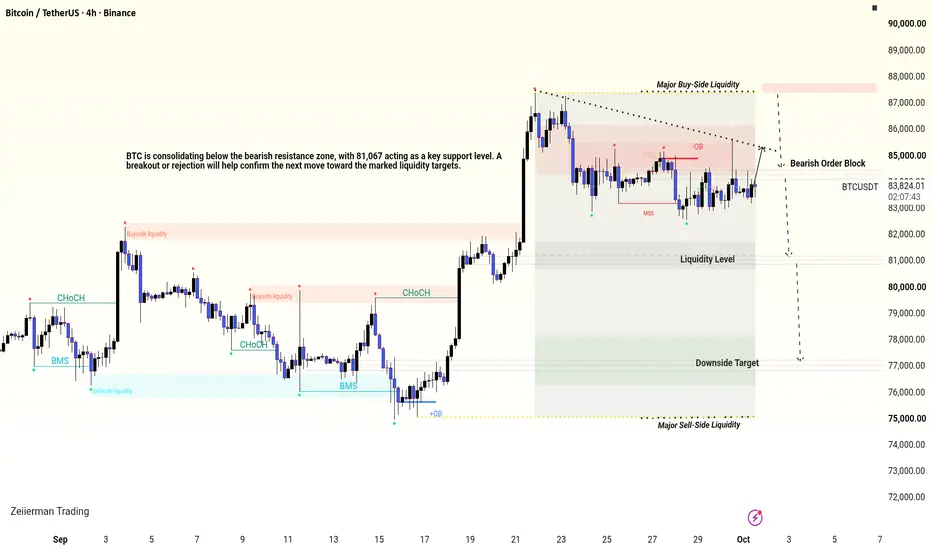
BTCUSDT — 4H Liquidity Structure, Compression & Potential Market Expansion
Market Overview
Bitcoin is currently trading around 83,736 USDT, following a strong bullish expansion from the 75,000–77,000 demand region toward the 87,380 liquidity zone.
After reaching the upper liquidity area, price experienced rejection and entered a sideways consolidation phase. The current structure shows a series of lower highs and repeated reactions around the 83,000–84,500 region.
The market is currently positioned between important liquidity levels, where a breakout or breakdown may determine the next significant move.
The key objective is to monitor price action around the marked liquidity zones rather than anticipate a direction without confirmation.
Key Market Levels
Major Buy-Side Liquidity: 87,380
This is the upper liquidity reference and previous high area. A move toward this level may attract breakout buyers and trigger resting liquidity.
Bearish Order Block + FVG: 84,500–85,000
This region represents a potential supply area where sellers previously reacted. If price retraces into this zone and produces bearish confirmation, it may create another downside opportunity.
Current Market Price: 83,736
Price is currently consolidating below the upper resistance structure. This area requires patience because both bullish and bearish liquidity remain relevant.
Key Support / Liquidity: 81,067
This is the first major downside reference. A breakdown and successful retest may increase the possibility of further bearish expansion.
Major Downside Target: 77,064
This level represents an important lower liquidity and demand reference.
Major Demand / Sell-Side Liquidity: 75,026
The lower region is a significant structural area where a liquidity sweep and bullish reaction may become relevant if price reaches it.
Current Market Structure
The broader chart shows a strong bullish displacement from the lower demand region, followed by rejection near the 87,380 high.
After the rejection, price started forming lower highs beneath the descending resistance line. The appearance of a Market Structure Shift (MSS) indicates that short-term momentum has changed from the previous bullish expansion.
However, the broader bullish structure is not automatically invalidated simply because price is consolidating. Confirmation through support breaks, resistance breaks, and retests remains important.
Scenario 1 — Bullish Expansion
If buyers regain control and price breaks above the descending resistance and the 84,500–85,000 supply region, a bullish continuation may develop.
Potential path:
83,736 → 84,500 → 85,000 → 86,000 → 87,380
A confirmed breakout followed by a successful retest would provide stronger evidence of bullish continuation.
The 87,380 level remains the major upside liquidity reference.
Scenario 2 — Bearish Expansion
If price continues to respect the descending resistance and breaks below the current consolidation support, sellers may attempt to push price toward the lower liquidity zones.
Potential path:
83,736 → 82,500 → 81,067 → 79,000 → 77,064
If bearish momentum continues, the 75,026 region becomes another important downside reference.
A breakdown followed by a bearish retest would strengthen the bearish scenario.
Why Is Bitcoin Moving Sideways?
After a strong upward expansion, price often enters a consolidation phase where buyers and sellers compete for control.
In the current structure:
- Lower highs indicate that upside momentum is facing resistance.
- The bearish Order Block and FVG represent a potential selling area.
- The 81,067 level acts as an important downside reference.
- The market is building liquidity on both sides of the current range.
This does not confirm an immediate breakout or breakdown. The next structural confirmation will be important.
Trading Plan — Key Reaction Zones
1. Current Consolidation: 83,000–84,500
Avoid treating the middle of the range as an automatic entry area. Wait for a liquidity sweep, CHoCH or MSS, and a confirmation candle.
2. Bearish Reaction: 84,500–85,000
If price retraces into the bearish OB/FVG and produces a bearish rejection, the potential downside references are:
TP1: 83,000
TP2: 81,067
TP3: 77,064
3. Bullish Breakout: Above 85,000
Wait for a confirmed breakout and retest before considering bullish continuation.
Potential upside references:
TP1: 86,000
TP2: 87,380
4. Support Breakdown: Below 81,067
A confirmed breakdown and bearish retest may open the way toward 77,064 and potentially 75,026.
5. Major Demand: 75,026–77,064
If price reaches this region and produces a bullish liquidity sweep followed by a confirmed structural shift, a recovery scenario may become relevant.
Risk Management
- Wait for confirmation instead of entering solely because price touches a marked level.
- Place stop loss beyond the relevant structure or liquidity wick.
- Avoid chasing candles after a large displacement.
- Reduce exposure during high-impact economic announcements.
- Consider partial profit-taking at predefined targets.
- Never risk more than your planned account risk.
Final Market Outlook
BTCUSDT is currently showing a consolidation structure beneath descending resistance, with 87,380 as the major upside liquidity reference and 81,067 as the key downside level.
A confirmed breakout may open the way toward higher liquidity, while a confirmed support breakdown may expose the lower demand regions.
The market has not confirmed either scenario yet.
Core Lesson: Let price confirm the direction. Liquidity, structure, and risk management should guide the analysis—not emotion or prediction.
Disclaimer: This analysis is for educational purposes only and is not financial advice. Cryptocurrency markets are highly volatile. Always conduct your own research and manage risk responsibly.
Note
📊 BTCUSDT — BUY + SELL TRADE UPDATE 🔥Both marked trade setups have delivered their respective price movements.
🟢 BUY TRADE:
Entry: 83,000
Target Reached: 85,000
Profit: 2,000+ Pips ✅
🔴 SELL TRADE:
Entry: 85,000
Target Reached: 84,000
Profit: 1,000+ Pips ✅
🏆 TOTAL PRICE MOVEMENT: 3,000+ Pips
Both setups followed the marked market structure and liquidity levels.
Stay disciplined and hold according to the remaining target plan. Let the market complete the next move without emotional decisions.
📌 Patience, confirmation, and risk management remain the key principles.
Educational market analysis only. Pip movement is based on the stated price levels, before spreads and trading costs.
Trade active
Keep strong hold wait for my last target Trade closed manually
Sell trade active from 87k touch 84k 3k pips running total 6k running profit close to 50% trades 50% hold wait for my last target 
Related publications
Disclaimer
The information and publications are not meant to be, and do not constitute, financial, investment, trading, or other types of advice or recommendations supplied or endorsed by TradingView. Read more in the Terms of Use.
Related publications
Disclaimer
The information and publications are not meant to be, and do not constitute, financial, investment, trading, or other types of advice or recommendations supplied or endorsed by TradingView. Read more in the Terms of Use.