PVC Indicator – Sideways Market, Weak Bullish Volume & Liquidity Sweeps at Range High
📌 Market Context (BTCUSDT – 15m)
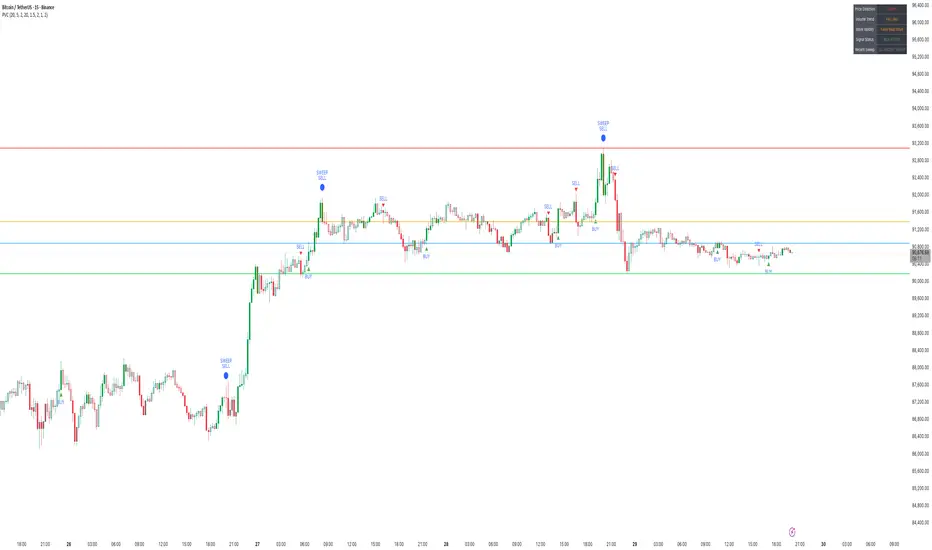
Bitcoin continues to trade in a well-defined sideways range, with price oscillating between the previous day’s High, Low, Close, and VWAP levels.
What stands out is that most short-term moves — especially bullish attempts — lack meaningful volume confirmation. On the PVC indicator, this shows up as gray candles, which indicate no correlation between price direction and volume participation.
This lack of price-volume alignment is typical of a range-bound market, where price fluctuates but institutional participation remains muted.
⸻
1️⃣ Multi-Day OHLC Levels Acting as Strong Support & Resistance
The Multi-Day OHLC module plotted on the chart is playing a major role in revealing why the market has been stuck in a range:
• Previous Day High (PDH) → Strong Resistance
Price repeatedly tapped and rejected from PDH, showing liquidity hunts and seller absorption, especially during the large top-side sweep.
• Previous Day Low (PDL) → Reliable Support
The market bounced multiple times from the PDL region, confirming buyers defending the lower boundary of this range — but without strong volume, which prevents any sustained rally.
• Previous Day Close & VWAP → Mid-Range Magnet
These acted as mean reversion points:
• Price frequently returned to Daily Close/VWAP
• PVC candles stayed gray
• No volume expansion occurred
This behavior confirms that the market is rotating inside a fair value zone, not trending.
Conclusion from OHLC Levels:
The repeated interaction with these levels — without breakout volume — indicates classic sideways behavior, where price respects previous day key levels and rotates between them without a directional follow-through.
⸻
2️⃣ Liquidity Sweep at the Top – Clear Stop-Hunt & Reversal
A clean bearish liquidity sweep formed at the top of the range:
• Price spiked above PDH
• Collected stop-losses
• Closed back inside the range
• PVC turned red with strong volume alignment
This confirms the sweep was real, and sellers stepped in exactly at a major resistance level.
⸻
3️⃣ Weak Bullish Volume → No Momentum Follow-Through
Across the last 24 hours:
• Very few green PVC candles (True Bull Moves)
• Majority of candles remain neutral/gray
• BUY signals trigger but lack follow-through because volume does not expand
This indicates no aggressive demand — price moves up occasionally, but without participation.
⸻
4️⃣ Bearish Moves Have Volume Support
Interestingly, PVC shows:
• Red candles where volume rises during declines
• SELL signals aligning with volume spikes
• Bearish sweeps occurring at key resistance
This means sellers are more active than buyers, even though the overall structure is sideways.
⸻
🎯 Summary
• Market: Sideways / Range-bound
• OHLC Behavior: Daily High–Low–Close acting as clean support & resistance
• Top Sweep: Strong rejection from PDH with volume confirmation
• Volume Trend: Weak on bullish moves, stronger on declines
• PVC Reading: Mostly gray → no real correlation → low conviction environment
• Bias: Neutral to slightly bearish until PVC prints green confirmation (Price Up + Volume Up)
PVC helps to clearly distinguish between fake rotations and true momentum, while the OHLC levels provide a structural map of where liquidity sits.
This analysis is for educational and informational purposes only. Not financial advice.
📌 Market Context (BTCUSDT – 15m)
Bitcoin continues to trade in a well-defined sideways range, with price oscillating between the previous day’s High, Low, Close, and VWAP levels.
What stands out is that most short-term moves — especially bullish attempts — lack meaningful volume confirmation. On the PVC indicator, this shows up as gray candles, which indicate no correlation between price direction and volume participation.
This lack of price-volume alignment is typical of a range-bound market, where price fluctuates but institutional participation remains muted.
⸻
1️⃣ Multi-Day OHLC Levels Acting as Strong Support & Resistance
The Multi-Day OHLC module plotted on the chart is playing a major role in revealing why the market has been stuck in a range:
• Previous Day High (PDH) → Strong Resistance
Price repeatedly tapped and rejected from PDH, showing liquidity hunts and seller absorption, especially during the large top-side sweep.
• Previous Day Low (PDL) → Reliable Support
The market bounced multiple times from the PDL region, confirming buyers defending the lower boundary of this range — but without strong volume, which prevents any sustained rally.
• Previous Day Close & VWAP → Mid-Range Magnet
These acted as mean reversion points:
• Price frequently returned to Daily Close/VWAP
• PVC candles stayed gray
• No volume expansion occurred
This behavior confirms that the market is rotating inside a fair value zone, not trending.
Conclusion from OHLC Levels:
The repeated interaction with these levels — without breakout volume — indicates classic sideways behavior, where price respects previous day key levels and rotates between them without a directional follow-through.
⸻
2️⃣ Liquidity Sweep at the Top – Clear Stop-Hunt & Reversal
A clean bearish liquidity sweep formed at the top of the range:
• Price spiked above PDH
• Collected stop-losses
• Closed back inside the range
• PVC turned red with strong volume alignment
This confirms the sweep was real, and sellers stepped in exactly at a major resistance level.
⸻
3️⃣ Weak Bullish Volume → No Momentum Follow-Through
Across the last 24 hours:
• Very few green PVC candles (True Bull Moves)
• Majority of candles remain neutral/gray
• BUY signals trigger but lack follow-through because volume does not expand
This indicates no aggressive demand — price moves up occasionally, but without participation.
⸻
4️⃣ Bearish Moves Have Volume Support
Interestingly, PVC shows:
• Red candles where volume rises during declines
• SELL signals aligning with volume spikes
• Bearish sweeps occurring at key resistance
This means sellers are more active than buyers, even though the overall structure is sideways.
⸻
🎯 Summary
• Market: Sideways / Range-bound
• OHLC Behavior: Daily High–Low–Close acting as clean support & resistance
• Top Sweep: Strong rejection from PDH with volume confirmation
• Volume Trend: Weak on bullish moves, stronger on declines
• PVC Reading: Mostly gray → no real correlation → low conviction environment
• Bias: Neutral to slightly bearish until PVC prints green confirmation (Price Up + Volume Up)
PVC helps to clearly distinguish between fake rotations and true momentum, while the OHLC levels provide a structural map of where liquidity sits.
This analysis is for educational and informational purposes only. Not financial advice.
Thanks.
TradeTech Analysis
Telegram Channel - t.me/Tradetech2024
Youtube Channel - youtube.com/@TradeTechAnalysis
Website - tradetechanalysis.com/
Super Profile - superprofile.bio/tradetechanalysis
TradeTech Analysis
Telegram Channel - t.me/Tradetech2024
Youtube Channel - youtube.com/@TradeTechAnalysis
Website - tradetechanalysis.com/
Super Profile - superprofile.bio/tradetechanalysis
Related publications
Disclaimer
The information and publications are not meant to be, and do not constitute, financial, investment, trading, or other types of advice or recommendations supplied or endorsed by TradingView. Read more in the Terms of Use.