
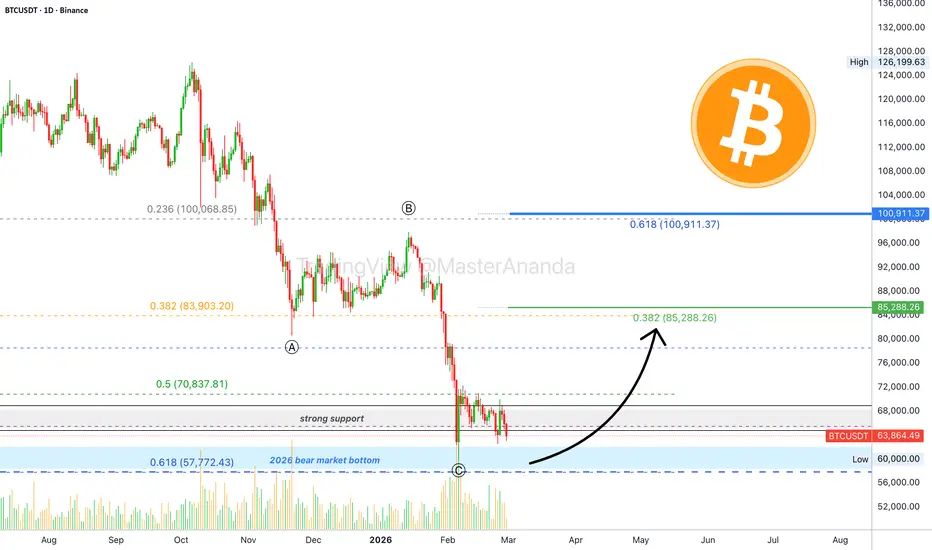
Bitcoin is in a very interesting position right now. The trading is happening right below the April 2021 all-time high, which was a price of $64,000. Also below November 2021 at $69,000. Right below these two. 'Below support' in this case.
But there is more.
Bitcoin is trading above the 6-February low at $60,000, and also above the most recent higher low around $62,510. The second one can easily break but this would only produce a better entry.
How to approach this chart setup? What is the thinking behind a trade like this one?
Bitcoin has been sideways for three weeks. It is easy to assume that this pattern can continue. When the action reaches the upper-end of the boundary, the resistance zone, profits can be taken; "sell at resistance." When the action reaches the lower boundary, the support zone, buying can be done; "buy at support."
Bitcoin is trading close to the lower end. Unfortunately, not at $60,000 but very close. This gives us an opportunity to go long.
This is a high-risk trade-setup. Caution is advised. (Experts only!)
Full trade-numbers below:
_____
LONG BTCUSDT
Leverage: 20X
Potential: 1355%
Allocation: 3%
Entry zone: $61,100 - $64,100
Targets:
1) $69,050
2) $74,565
3) $79,023
4) $83,481
5) $89,828
6) $97,913
7) $106,829
Stop: Close weekly below $61,000
_____
When in doubt, go small.
There is nothing like practice, first hand experience to learn and grow.
Even if you are not fully prepared, experience can be gained through a very small position... Just enter, buy and hold, let the market take care of the rest.
Opportunities are endless. When one goes, another one will always show up—forever. That's the beauty of trading. We only need to persist to succeed.
Keep an open mind.
Thanks a lot for your continued support.
Time to trade.
Namaste.
Trade active
This chart setup already generated +135%. I hardly believe I need to mention this but, it would be wise to secure your trade after such strong growth. You can take the initial and play it safe. When it crashes, you can buy back lower.The market is about to enter a strong bullish period. Do not be surprised if we experience very strong volatility before the start of a the next bullish wave. That is, a major crash followed by a recovery, a shakeout.
Thank you for reading. We are getting close... But a surprise is coming.
Namaste.
Trade closed: target reached
We are going SHORT now. New entry below the last low. Actually, we focus on the drop and the market will let us know when to best enter again.Here some updates:
Bitcoin breaks decisively above EMA55 & EMA89 4H TF
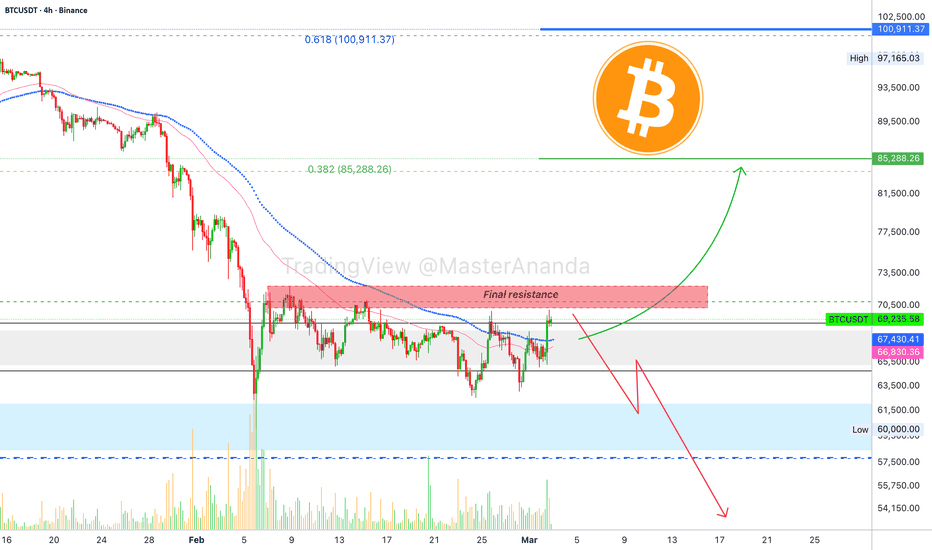
Caution! Ethereum trades below resistance, bearish potential

Bitcoin monthly (March 2026) & the altcoins market


💯 TOP Results (Sept 2026) 👇
t.me/masteranandatrades/9279
🔥 10-25X Leverage, Results & Profits
t.me/masteranandatrades/9271
✅ 4 PREMIUM Telegram channels special offer
—One-Time Payment! (🔝 since 2017)
t.me/lamatrades/4
t.me/masteranandatrades/9279
🔥 10-25X Leverage, Results & Profits
t.me/masteranandatrades/9271
✅ 4 PREMIUM Telegram channels special offer
—One-Time Payment! (🔝 since 2017)
t.me/lamatrades/4
Related publications
Disclaimer
The information and publications are not meant to be, and do not constitute, financial, investment, trading, or other types of advice or recommendations supplied or endorsed by TradingView. Read more in the Terms of Use.