
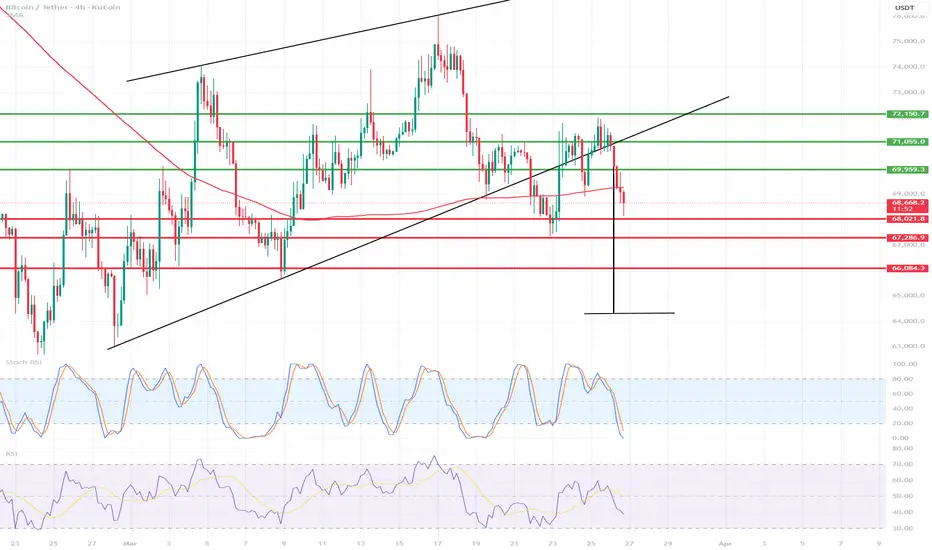
📊 Overall picture (4H BTCUSDT)
The market was in an uptrend (ascending channel) — marked with black lines.
We are currently experiencing a downward breakout from this structure.
The price has lost trend and returned below the average (red line) → bearish signal.
👉 This is no longer a pure uptrend — we are in a correction phase / possible short-term reversal.
🔴 Key levels
Support:
68,000 – 68,200 → currently tested / broken
67,200 – 67,300 → local support
66,000 → strong support (if it falls here → larger correction)
Resistance:
69,900 – 70,000
71,000
72,150 (top range)
⚠️ What just happened?
Rejection from ~72k
Lower high → LH (lower high)
Strong downward impulse
Trendline + SMA breakout
👉 This is a classic bearish structure shift (short-term)
📉 Indicators
Stoch RSI:
Down → Downward momentum continues
No clear rebound yet
RSI:
Drops below 50 → Sellers prevail
No divergence → Declines may deepen
🔎 Scenarios
🟥 Bearish (more likely now)
If we stay below 68k:
Target: 67.2k
Then: 66k
👉 If 66k breaks → a larger correction may follow (even 63–64k)
🟩 Bullish (conditional)
If BTC:
will return above 69.5–70k
will regain the trendline
👉 then:
return to 71k
possible retest of 72k

Disclaimer
The information and publications are not meant to be, and do not constitute, financial, investment, trading, or other types of advice or recommendations supplied or endorsed by TradingView. Read more in the Terms of Use.
Disclaimer
The information and publications are not meant to be, and do not constitute, financial, investment, trading, or other types of advice or recommendations supplied or endorsed by TradingView. Read more in the Terms of Use.