
🧭 PCCE + False Breakout Detector – Decoding Expansion, Exhaustion & Reversal Zones
How It Worked on the Chart
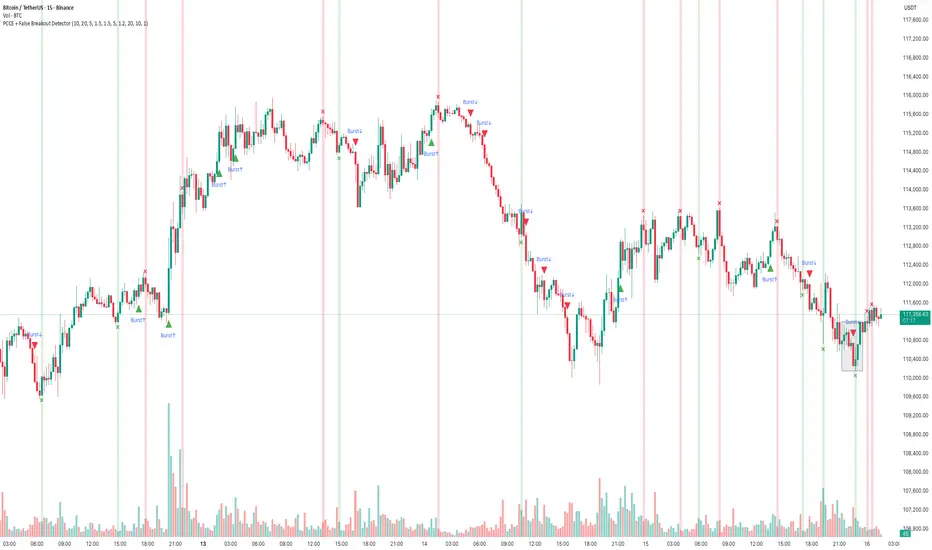
In this BTC/USDT 15-minute chart, the indicator detected several Price Coil Compression & Expansion (PCCE) phases and confirmed false breakouts with visual clarity:
• Green vertical zones represent bullish expansion bursts — price coils tightly, then breaks upward with volume confirmation.
→ These often appear after sideways congestion, signaling early trend ignition.
• Red vertical zones mark bearish expansion bursts — price expands downward after compression, usually following distribution-like setups.
→ Notice how each burst frequently aligns with a decisive trend move.
• The “Burst↑ / Burst↓” labels highlight valid expansions confirmed by momentum and volume thrust conditions, showing continuation opportunities.
However, the true power lies in the False Breakout Detection System — the small “X”-shaped bullish (green) or bearish (red) crosses that appear at potential exhaustion points.
🔍 Interpreting the False Breakout Marks
The bullish “X” and bearish “X” crosses represent trap zones or deceptive breakouts that failed to sustain momentum beyond the coil’s boundary.
• Bearish X (Red): Price attempted to break higher but was rejected, often marking a short-term top.
→ Can be used as a signal to exit long trades or prepare for short entries once confirmation candle closes below.
• Bullish X (Green): Price dipped below the compression base but quickly re-entered, showing rejection of lower prices.
→ Indicates a failed breakdown, usable as an early long setup or exit from short positions.
🎯 How Traders Can Use It
1. For Entry Confirmation:
• Wait for a Burst↑ or Burst↓ label after a compression phase.
• Enter in the direction of the expansion, confirming with volume or candle momentum.
2. For Exit or Reversal Spotting:
• Use the False Breakout crosses as smart exit markers.
→ If you are long and a red “X” appears near the top, consider partial profit or tighten stops.
→ If short and a green “X” appears near the bottom, expect possible short covering.
3. For Reversal Trading:
• Combine “Burst” direction with the opposite false breakout mark.
Example: After a Burst↓ (bearish move), if a bullish X appears, it suggests exhaustion — a reversal or pullback may begin
💡 Practical Takeaway
The PCCE + False Breakout Detector effectively blends volatility compression theory with trap pattern logic, letting traders:
• Spot pre-move compression zones,
• Identify false breakouts and momentum traps, and
• Time exits or reversals with visual precision.
This makes it a dual-purpose tool — both a trend-continuation detector and a reversal warning system — ideal for intraday and swing traders across all markets.

Thanks.
TradeTech Analysis
Telegram Channel - t.me/Tradetech2024
Youtube Channel - youtube.com/@TradeTechAnalysis
Website - tradetechanalysis.com/
Super Profile - superprofile.bio/tradetechanalysis
TradeTech Analysis
Telegram Channel - t.me/Tradetech2024
Youtube Channel - youtube.com/@TradeTechAnalysis
Website - tradetechanalysis.com/
Super Profile - superprofile.bio/tradetechanalysis
Disclaimer
The information and publications are not meant to be, and do not constitute, financial, investment, trading, or other types of advice or recommendations supplied or endorsed by TradingView. Read more in the Terms of Use.