
Executive Summary:
Margin of safety verdict: No observable margin of safety exists at current prices because the company has no recurring revenue, no positive free cash flow, and valuation depends almost entirely on the success of a single experimental oncology drug.
Celcuity is the kind of company that sits awkwardly inside a traditional value investing framework. It is a clinical stage biotechnology firm whose economic future is tied primarily to one lead therapeutic candidate, gedatolisib, which targets the PI3K AKT mTOR signaling pathway in cancer.
The upside from a successful oncology drug can be enormous. Patented targeted therapies often command very high gross margins and can generate durable demand once they become embedded in treatment guidelines. The problem is the probability distribution. Most clinical drug programs never reach commercial success.
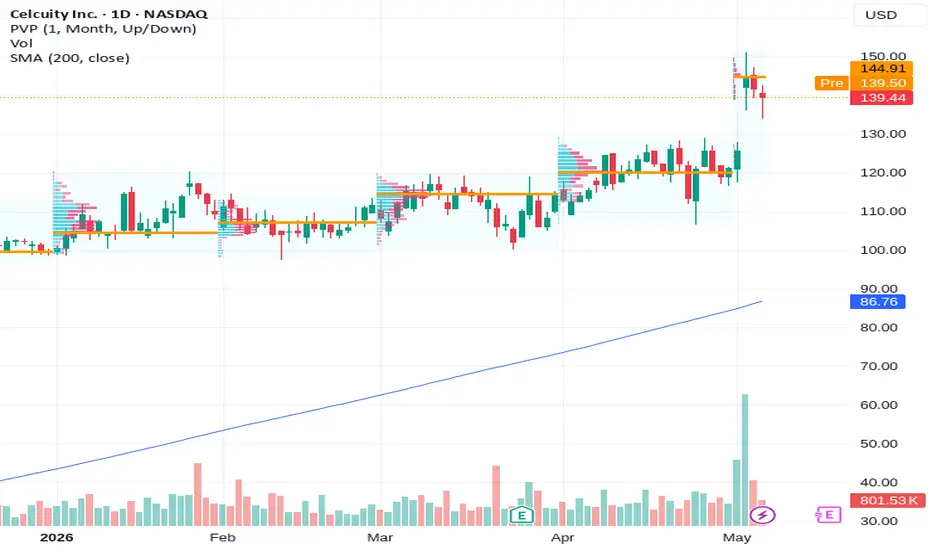
With a market capitalization in the billions and a share price above 100, investors appear to be assigning a meaningful probability to successful clinical results and eventual commercialization. Yet the current business produces no stable earnings, no positive free cash flow, and has relied heavily on equity dilution to fund development.
For investors who insist on predictable returns on capital and a clear discount to intrinsic value, the stock looks less like a traditional investment and more like a venture style option.
One Stock, Dozens of Voices:
This is not one analyst's opinion. CrowdWisdom aggregated 4 independent sources for CELC (1 live market intelligence feeds; 2 prior CrowdWisdom analysis snapshots (internal archive); 1 verified financial data checks (Yahoo Finance)) and synthesized the shared thesis: what do dozens of traders, investors, and researchers broadly agree on, where do they disagree, and what might the market be missing?
Those viewpoints were then stress tested by placing opposing interpretations side by side: a bull case, a bear case that challenges the consensus, and an examination of what expectations may already be embedded in the stock price. All financial metrics were cross validated against live market data.
What follows highlights where views converge, where they diverge, and whether the stock offers any genuine margin of safety at today’s price.
Business Quality and Moat Durability:
Celcuity’s strategy sits at the intersection of targeted oncology therapies and diagnostic driven patient selection. Its lead drug candidate, gedatolisib, is designed to inhibit the PI3K AKT mTOR signaling pathway, which is linked to tumor growth and treatment resistance across several cancer types.
Alongside the drug program, the company has developed the CELsignia diagnostic platform. The idea is to measure tumor signaling activity and identify patients most likely to benefit from pathway targeted therapies.
If the drug and diagnostic approach works, it could eventually form a defensible position in precision oncology. Therapies that demonstrate strong outcomes in biomarker defined patient populations often become embedded in treatment protocols and clinical guidelines. Once that happens, physicians tend to stick with the established therapy because both clinical evidence and habit reinforce adoption.
At the moment, however, that moat is entirely prospective.
Celcuity has no approved drug and no commercial diagnostic platform generating revenue. Until the science is validated through clinical trials and regulators grant approval, any competitive advantage remains theoretical.
The oncology landscape is also intensely competitive. Large pharmaceutical companies continuously develop antibody drug conjugates, immunotherapy combinations, and next generation targeted treatments. Over time, any of these approaches could reduce the relevance of PI3K pathway inhibitors.
Moat durability verdict: nonexistent today, potentially emerging only after clinical and regulatory validation.
Return on Invested Capital (ROIC):
Return on invested capital is one of the clearest ways to judge business quality. In Celcuity’s case, the metric is currently negative and not especially useful.
Clinical stage biotechnology companies spend heavily on research and development long before any product revenue appears. That creates a long stretch where capital is consumed rather than compounded.
Available evidence suggests free cash flow losses have deepened over time, falling from approximately negative 36 million in 2022 to roughly negative 153 million by 2025. Each year of clinical development adds to invested capital while generating no return.
The bullish view assumes a dramatic ROIC inflection if the drug reaches approval. Oncology drugs can produce gross margins above 80 percent, and once revenue begins, incremental sales often carry significant operating leverage.
But that inflection depends on a chain of uncertain events. Late stage clinical trials must succeed. Regulators such as the FDA must grant approval. Oncologists must adopt the therapy. Insurers must reimburse it favorably. Finally, the company must either build commercial infrastructure or partner with a large pharmaceutical firm.
Until those milestones occur, every additional dollar invested continues to produce negative economic returns.
Quality of Earnings:
The quality of earnings discussion is straightforward because the company has no meaningful earnings today.
Revenue is minimal or nonexistent, operating margins are negative, and free cash flow remains deeply negative due to ongoing research spending.
The financing required to support those losses is more concerning. Evidence suggests the share count expanded dramatically over the past several years, rising from roughly 21.7 million shares in 2022 to more than 48 million shares by 2025.
Dilution at that scale materially changes the economics for existing shareholders. Even if the company eventually launches a successful therapy, those future profits will now be spread across a much larger share base.
In practical terms, investors are financing a long research effort while absorbing continuing dilution risk.
Capital Allocation Scorecard:
For a clinical stage biotechnology company, capital allocation largely means one thing: funding research and development.
Celcuity’s spending reflects that reality. Most capital goes toward clinical trials, regulatory preparation, and scientific development.
Traditional capital allocation tools that appear in mature businesses are absent. There are no share repurchases, no dividends, and no large scale acquisitions.
That absence does not necessarily signal poor discipline. It simply reflects the company’s stage of development. Still, investors should recognize that the business has not yet demonstrated the ability to allocate capital at returns above its cost of capital.
Customer and Revenue Concentration:
Traditional customer concentration analysis does not apply because Celcuity has not yet built a commercial customer base.
Instead, the company faces extreme pipeline concentration.
Nearly all economic value in the business depends on the success of a single therapeutic asset: gedatolisib.
If late stage trials fail, if safety concerns appear, or if the drug proves inferior to competing therapies, most of the company’s economic value could disappear.
In effect, the company is 100 percent exposed to the outcome of one experimental product.
Management Alignment:
Public data within the available evidence set does not provide a detailed breakdown of insider ownership or executive compensation structures.
In biotechnology firms, management incentives are often linked to clinical milestones rather than economic returns. Executives may receive equity awards for advancing trials or submitting regulatory applications rather than generating long term profitability.
Without detailed filings it is difficult to judge alignment precisely. Investors should review insider ownership levels and compensation incentives carefully before forming strong conclusions about governance.
10-Year Durability Test:
Forecasting the oncology landscape ten years from now is extremely difficult.
Several structural forces could weaken the long term relevance of Celcuity’s strategy.
First, oncology drug development moves quickly. Entire treatment approaches can change as new modalities emerge.
Second, antibody drug conjugates have become one of the fastest growing areas in oncology. These targeted chemotherapy delivery systems could compete directly with pathway inhibitors in several cancers.
Third, immunotherapy combinations continue expanding into earlier treatment lines across many tumor types.
Fourth, regulatory and reimbursement pressure on drug pricing may affect future profitability.
Even if gedatolisib receives approval, its commercial lifespan will depend on whether newer therapies eventually outperform it.
Given the pace of innovation in oncology, predicting the competitive environment in 2036 with confidence is extremely difficult.
For many generalist investors, this places the company squarely in the too hard pile.
Multi-Year Thesis (3 to 7 years):
Because Celcuity has no current revenue or earnings, valuation relies on probability weighted scenario analysis rather than traditional discounted cash flow models.
Bear Case
Probability: 50 percent
In the bear scenario, late stage clinical trials fail or demonstrate insufficient efficacy, regulatory approval is denied or delayed, and the company must continue raising capital to survive.
Estimated intrinsic value: 10 to 20 per share.
Under these conditions, most of the company’s valuation disappears because the primary asset loses commercial viability.
Base Case
Probability: 35 percent
In the base scenario, gedatolisib receives regulatory approval for a limited oncology indication. Commercialization occurs through a partnership with a larger pharmaceutical company, and adoption is moderate due to competition from other therapies.
Estimated intrinsic value: 80 to 120 per share.
This outcome produces a viable oncology product but not a dominant one.
Bull Case
Probability: 15 percent
In the bullish scenario, Phase III results show clear superiority in a large cancer population. Physician adoption accelerates once the therapy appears in treatment guidelines, and additional label expansions follow across other tumor types.
Estimated intrinsic value: 250 to 350 per share.
In that environment, the company evolves into a profitable oncology franchise with strong pricing power and pharmaceutical style margins.
Probability weighted intrinsic value estimate: approximately 95 to 110 per share.
Margin of Safety Verdict:
At recent market prices in the roughly 125 to 140 range, the stock appears to trade above its probability weighted intrinsic value.
More importantly, the valuation has no firm anchor. There are no observable cash flows, no proven history of returns on invested capital, and no stable earnings base to model.
Without that economic foundation, the margin of safety framework that value investors rely on becomes difficult to apply.
The investment therefore turns into a bet on clinical outcomes rather than the purchase of a proven compounding business at a discount.
Peak Margin Stress Test:
Biotech valuation models often assume extremely high margins once a drug reaches the market.
Oncology therapies frequently generate gross margins above 80 percent because manufacturing costs are small relative to pricing.
If pricing pressure or competition pushes peak margins down to 60 percent instead of 85 percent, the impact on valuation could be significant.
Under a lower margin structure, the implied equity value from many peak sales models might fall by 30 to 50 percent.
Given that current expectations likely assume strong pharmaceutical style margins, any compression could materially reduce long term equity value.
Valuation Framing:
Three valuation perspectives are relevant.
First, traditional discounted cash flow models are unreliable because revenue forecasts depend on uncertain clinical outcomes.
Second, comparable biotechnology valuations suggest that a successful oncology drug producing one billion dollars in annual sales could support enterprise values in the mid single digit billions.
Third, probability weighted analysis places intrinsic value near or slightly below the current share price.
In short, the market seems to be valuing Celcuity as a credible oncology development story rather than a distressed or undervalued opportunity.
Perception vs Reality:
Perception: Celcuity could become a high margin oncology drug company if its lead therapy succeeds.
Reality: Investors are currently paying for a future pharmaceutical franchise that has not yet been clinically validated.
Why This May Be Misunderstood:
Biotechnology investing often encourages optimistic thinking because the winners can produce extraordinary returns.
But survivorship bias plays a major role. Investors remember the blockbuster successes and tend to forget the many failed clinical programs that never reach the market.
Early trial data can also look promising before larger trials reveal safety problems or weaker efficacy.
In addition, analyst enthusiasm often clusters around upcoming catalysts such as Phase III readouts, which can temporarily inflate expectations.
Three Measurable Things to Watch Next Quarter:
Progress updates from late stage clinical trials involving gedatolisib.
Changes in the company’s cash burn rate and the remaining liquidity runway.
Any strategic partnership discussions with large pharmaceutical companies that could help finance commercialization.
Historical Conviction Drift:
Market enthusiasm for Celcuity appears closely tied to clinical developments rather than financial performance.
Analyst ratings remain overwhelmingly positive, with most recommending buying the stock. Those recommendations, however, depend heavily on expectations of future clinical success.
Investor conviction could therefore swing sharply as trial results and regulatory milestones emerge.
Disconfirming Evidence:
The strongest argument against owning Celcuity is straightforward.
The company currently lacks the three characteristics that define durable investments: predictable revenue, positive free cash flow, and observable returns on invested capital.
Without those features, estimating intrinsic value becomes highly uncertain.
Until a commercial product exists, shareholders are essentially financing a scientific experiment.
Risks:
Binary outcomes from clinical trials remain the central risk.
Continued shareholder dilution through equity financing is likely.
Regulatory approval could be delayed or denied.
Competing oncology therapies could limit the drug’s relevance.
Biotech sector valuations may compress during periods of higher interest rates.
Summary:
Celcuity reflects the classic asymmetry seen in biotechnology. If its lead therapy succeeds, the company could develop into a profitable oncology franchise with strong margins.
Today, however, the business has no revenue, no positive free cash flow, and no demonstrated ability to generate returns on capital.
At current prices the stock appears to reflect optimistic expectations about clinical success rather than a clear discount to intrinsic value.
For investors who require a margin of safety and predictable compounding, Celcuity likely belongs in the too hard pile until clinical and commercial uncertainty becomes clearer.
Data Snapshot:
Current Price 141.69
Metric: Value
Current Price (CELC): $141.69
Market Capitalization: $6.85 billion
Shares Outstanding: 48,336,675
Trailing P/E: N/A
Forward P/E: -104.18x
Enterprise Value (EV): $6.73 billion
EV/EBITDA: -39.12x
Revenue (TTM): N/A
Gross Margin: 0.00%
Operating Margin: 0.00%
Free Cash Flow (FCF): $-96.05 million
FCF Yield: -1.40%
52-Week Range: $9.51 to $151.02
Sector: Healthcare
Industry: Biotechnology
References:
This analysis reviewed approximately 57 article sources and 77 video transcripts.
1. AlphaSpread. Celcuity Inc Summary. alphaspread.com/security/nasdaq/celc/summary
2. Zacks Investment Research. CELC Stock Style Scores. zacks.com/stock/research/CELC/stock-style-scores
3. Public.com. Celcuity PE Ratio. public.com/stocks/celc/pe-ratio
4. MarketBeat. Celcuity Stock Overview. marketbeat.com/stocks/NASDAQ/CELC/
5. GuruFocus. Celcuity Sees Significant Price Jump. gurufocus.com/news/8839807/celcuity-celc-sees-significant-price-jump-of-184
6. Yahoo Finance. Celcuity Still Attractive Strong. finance.yahoo.com/markets/stocks/articles/celcuity-celc-still-attractive-strong-011515890.html
7. Simply Wall St. Is It Too Late to Consider Celcuity. simplywall.st/stocks/us/pharmaceuticals-biotech/nasdaq-celc/celcuity/news/is-it-too-late-to-consider-celcuity-celc-after-its-strong-mu
8. Simply Wall St. Celcuity Company Overview. simplywall.st/stocks/us/pharmaceuticals-biotech/nasdaq-celcuity
9. StockAnalysis. Celcuity Statistics. stockanalysis.com/stocks/celc/statistics/
10. Simply Wall St. Assessing Celcuity Valuation After FDA Priority Review. simplywall.st/stocks/us/pharmaceuticals-biotech/nasdaq-celc/celcuity/news/assessing-celcuity-celc-valuation-after-fda-priority-review-1
11. FullRatio. Celcuity Financial Ratios. fullratio.com/stocks/nasdaq-celc/celcuity
12. Fundamental Finance Playbook. Intrinsic Value. fundamentalfinanceplaybook.com/intrinsic-value/
13. Motley Fool Terms. Intrinsic Value Definition. fool.com/terms/i/intrinsic-value/
14. Financhill. Celcuity Stock Research. financhill.com/stocks/nasdaq/celc
15. McCracken Alliance. Intrinsic Value Definition and Examples. mccrackenalliance.com/blog/www-mccrackenalliance-com-blog-intrinsic-value-definition-calculation-examples-for-investors
16. Medium. How to Calculate Intrinsic Value Using PE Ratio. medium.com/@jdgb.projects/how-to-calculate-the-intrinsic-value-of-a-stock-using-the-p-e-ratio-9f19c31d294d
17. Wall Street Prep. Intrinsic Value Guide. wallstreetprep.com/knowledge/intrinsic-value/
18. Value Spreadsheet. Easy Intrinsic Value Formula. valuespreadsheet.com/blog/easy-intrinsic-value-formula
19. Sven Carlin. Intrinsic Value Formula. svencarlin.com/how-to-calculate-intrinsic-value-formula/
20. Market Chameleon. Celcuity Balance Sheet. marketchameleon.com/Overview/CELC/Balance-Sheet/
21. Macrotrends. Celcuity Long Term Investments. macrotrends.net/stocks/charts/CELC/celcuity/long-term-investments
22. Macrotrends. Celcuity Revenue History. macrotrends.net/stocks/charts/CELC/celcuity/revenue
23. Simply Wall St. Celcuity Past Financials. simplywall.st/stocks/us/pharmaceuticals-biotech/nasdaq-celc/celcuity/past
24. Public.com. Celcuity Earnings. public.com/stocks/celc/earnings
25. Market Chameleon. CELC Earnings Dates. marketchameleon.com/Overview/CELC/Earnings/Earnings-Dates/
26. MarketBeat. CELC Earnings. marketbeat.com/stocks/NASDAQ/CELC/earnings/
27. Yahoo Finance. Celcuity Valuation Discussion. finance.yahoo.com/markets/stocks/articles/too-consider-celcuity-celc-13x-002416117.html
28. ChartMill. CELC Earnings Analysis. chartmill.com/stock/quote/CELC/earnings
29. Yahoo Finance. CELC Historical Data. finance.yahoo.com/quote/CELC/history/
30. Yahoo Finance. CELC Quote. finance.yahoo.com/quote/CELC/
Disclaimer:
This analysis is for informational purposes only and does not constitute investment advice. Investors should conduct their own research and consider their financial situation before making investment decisions.

Disclaimer
The information and publications are not meant to be, and do not constitute, financial, investment, trading, or other types of advice or recommendations supplied or endorsed by TradingView. Read more in the Terms of Use.
Disclaimer
The information and publications are not meant to be, and do not constitute, financial, investment, trading, or other types of advice or recommendations supplied or endorsed by TradingView. Read more in the Terms of Use.