
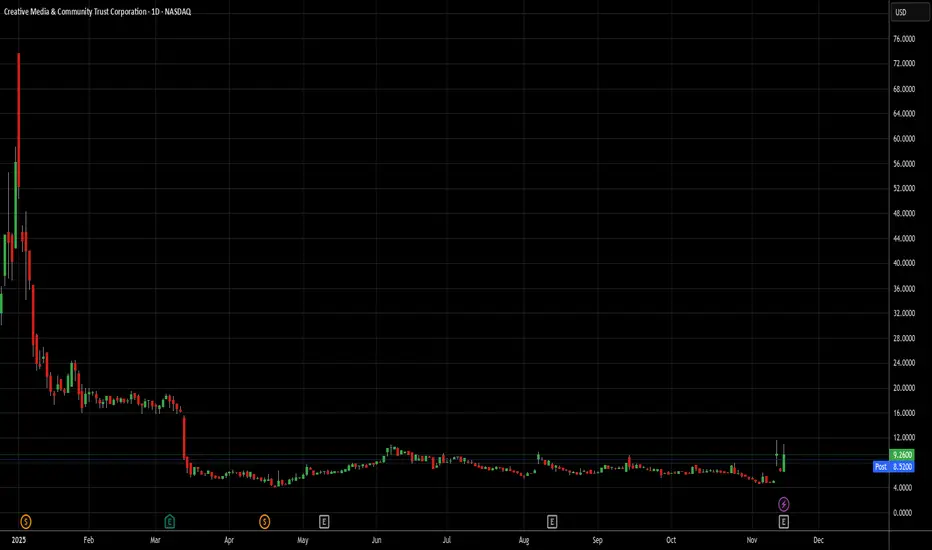
Where to start. First of all, my short backtest system now has over 1000 backtested trades in it and is 866-312 with an average gain of about 2.5% per trade and an avg. holding period of 1.26 days. That's +1.22% per day. doesn't seem like much, but that's +309% annualized. I'm still not trading it live, and don't suggest that anyone else does, but I'm going to be accountable here by posting. It's a system that can have both very big quick wins, and very big quick losses, so caveat emptor if you insist on trying this idea out on your own.
Additionally, CMCT is a stock that went public at a multiple reverse split adjusted price of $55,000 a share. It's now at 9.59 as I write this. In the last QUARTER, this 9.59 a share stock lost $23 a share. That's not a typo. It doesn't take a math major to figure out how sustainable that is. AND THAT'S BEING CELEBRATED TODAY with a nearly 40% pop in the stock price. It's a disaster. That said, I'm looking for a 1 day gain here, so short at 9.59 and unless the signal re-fires on Monday, I close it - win or lose. No tactical adding or selling like with my long system. Out almost immediately, fixed risk, win or lose.
Quick update I forgot to add earlier. I have been live paper trading this system since the end of September. Those live-ish trades have done better than the backtest. 71W-22L
Avg gain = +9.3%. Don't know if I've been lucky or what, but that's almost 10% of the backtest trades. What I have found, is that some stocks, for whatever reason, buck the trend and are far more often losers than winners. Why? I have no idea. I had 4 of those trades close today, 2 losers (RDGT after 2 days of re-firing and SPRU in 1 day) and 2 winners, both 1 day trades (TNMG -24% and SGBX -32%). When this works, it usually does right away, as the 1.25 day average hold would indicate. The losers are often more than 1 day trades, though some of those multi day trades do end up as winners.
Just an update since my previous short idea post. I will update each time I post one.
Also, sorry for the multiple posts, but the chart kept being a zoomed in one and you can't just edit that, you have to delete and repost. My apologies.
As always - this is intended as "edutainment" and my perspective on what I am or would be doing, not a recommendation for you to buy or sell. Act accordingly and invest at your own risk. DYOR and only make investments that make good financial sense for you in your current situation.
Trade closed: target reached
Well...that was a wild ride. That happens a lot with these, though. There's a discrepancy between my broker and TV regarding the closing price, and it's a significant difference. 9.19 vs. 9.11. I'll take the worse of the 2, just because TV often has to redo their closing prices for stocks. So 9.59 (remember I did this idea after hours on Friday) to 9.19 = +4.35% in one trading day. To be fair, I'm confident I would've gotten a fill at that price, given that after hours on Friday it hit 9.80 or so. The borrow fee was extraordinary and would've knocked a decent amount off my profits, however. Since this isn't a real trade, I wasn't going to go through all that when I posted, since I was trying to get the idea up quickly. That is a factor to consider with some of these trades, though. Lower float stocks tend to have pretty significant borrow rates. It doesn't matter when the trade goes 25% in your favor, but when it ends up being an only 1 or 2% gain, it can neuter your profits pretty significantly. That was my only short candidate on Friday, so I'll chalk that up as a nice gain - roughly 5% better than the market did today, lol.
Note
Trade results for my recordsWins 1
Losses 0
Avg gain per lot = +4.35%
Avg holding periods per lot = 1 day
Avg gain per lot per day held = 4.35%
Annualized RoR = 4.35% x 252 = +1096%
Note
It's actually +4.2%. I have a spreadsheet I use for calculating long trade returns and I just flipped it, but that causes the calculation to be based on the difference in price divided by 9.19 instead of 9.59 as it should be. I'm not deleting and redoing all that just to fix it, since the difference is pretty negligible.
Disclaimer
The information and publications are not meant to be, and do not constitute, financial, investment, trading, or other types of advice or recommendations supplied or endorsed by TradingView. Read more in the Terms of Use.
Disclaimer
The information and publications are not meant to be, and do not constitute, financial, investment, trading, or other types of advice or recommendations supplied or endorsed by TradingView. Read more in the Terms of Use.