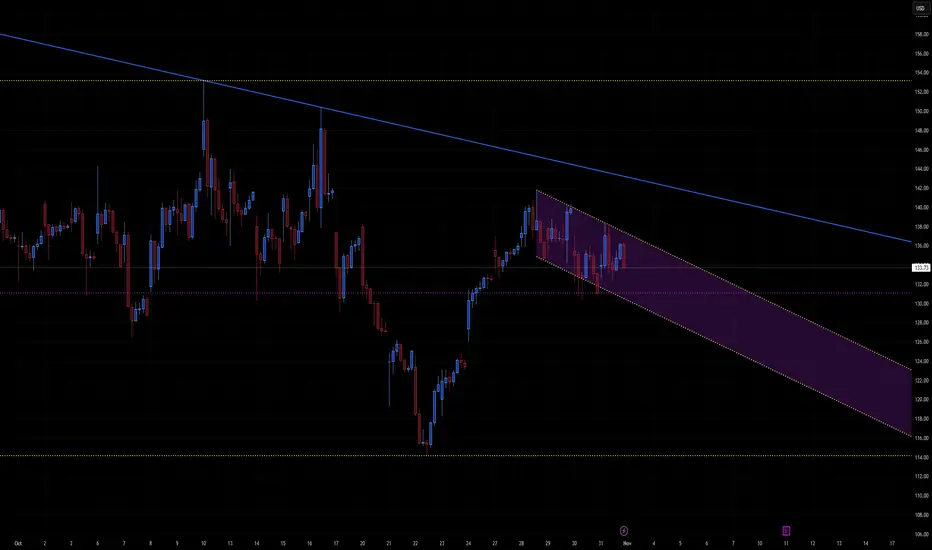
A descending parallel channel (purple shaded region) starting from the recent local high.
Current price near 133.7 USD, trading mid-channel.
Major horizontal supports around 130 and 116 (yellow dotted lines).
Overhead resistance near 138–140 USD and the top of the falling channel (~136–137 USD short-term).
This indicates controlled pullback within a bearish channel after a strong prior rebound — a typical flag pattern structure, which can resolve in either direction.
📈 Bullish Scenario
Setup:
Price has stabilized inside the descending channel and could stage a rebound if momentum returns.
Confirmation Triggers:
Break and daily close above 136–138 USD (channel breakout).
Volume pickup confirming accumulation rather than short covering.
Upside Targets:
144–146 USD → short-term resistance zone (top of previous consolidation).
150–154 USD → major target and measured-move projection from the flag pattern.
Catalysts:
Broader market risk-on sentiment (tech rebound, softer yields).
Positive company-specific or sector news.
Invalidation:
Daily close below 130 USD, re-entering lower half of channel.
📉 Bearish Scenario
Setup:
If price keeps respecting the descending channel and fails to reclaim 136–138 USD, the downtrend continues.
Confirmation Triggers:
Breakdown below 130 USD (support + midpoint of channel).
Bearish continuation with increasing volume.
Downside Targets:
122–124 USD → lower channel boundary (first logical support).
116 USD → key horizontal support and measured-move objective.
108–110 USD → extended bearish target if momentum accelerates.
Catalysts:
Market rotation out of growth / risk assets.
Rising yields or stronger dollar.
Invalidation:
Break and sustained close above 138 USD.
⚖️ Neutral / Range-Bound Outlook
Until price escapes 130–138 USD, expect choppy sideways trading within the channel.
Momentum indicators (RSI, volume) likely to flatten, signaling indecision before a larger move.
🧩 Summary Table
Bias Confirmation Target Zone Invalidation Notes
Bullish Close > 138 USD 144 → 150 → 154 USD < 130 USD Breakout of flag
Bearish Close < 130 USD 122 → 116 → 110 USD > 138 USD Continuation down
Neutral Range 130–138 USD — — Coiling phase
🕒 2–3 Week Projection
Bullish path: Price stabilizes 132–133 → breaks above 136 → targets 144 by mid-November.
Bearish path: Rejection at 136 → slips below 130 → tests 122–124 within next two weeks.
Disclaimer
The information and publications are not meant to be, and do not constitute, financial, investment, trading, or other types of advice or recommendations supplied or endorsed by TradingView. Read more in the Terms of Use.
Disclaimer
The information and publications are not meant to be, and do not constitute, financial, investment, trading, or other types of advice or recommendations supplied or endorsed by TradingView. Read more in the Terms of Use.