
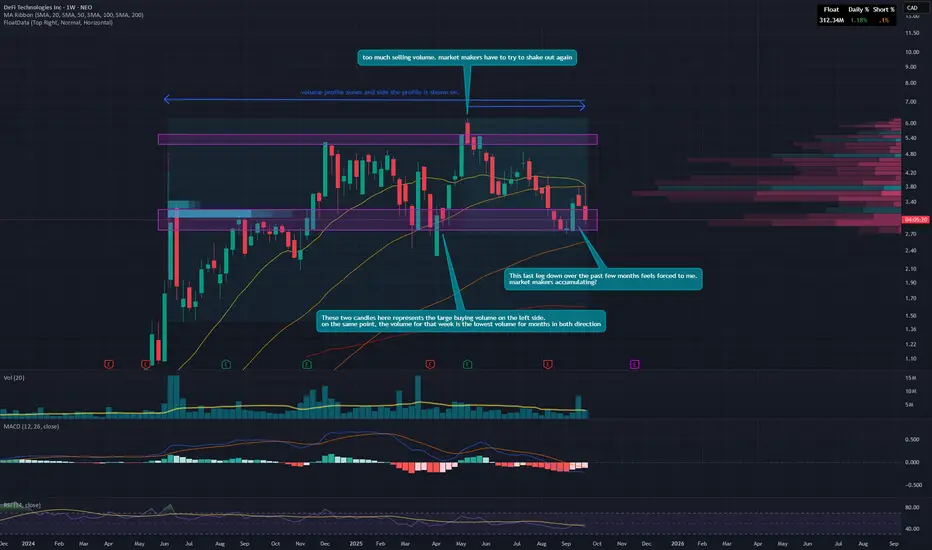
On a weekly chart to see the long-term story.
Back story: DEFI IPOs and goes from $0.80 to $3 in a month basically going straight up. Remember the $3. then it falls then climbs to $4 then falls to $0.10. goes sideways for a while then climbs up again to $0.80, then again to $3. This story is told repeatedly in many IPOs. After the IPO and the stock is pushed to nothing, the market makers keep an eye. They want to see if there is retail sentiment on the stock. DEFI climbed so the answer is yes. That brings us to our modern-day story.
Before I continue, let’s explain the volume profiles shown. The left profile covers the zone that the left facing arrow covers. The volume profile on the right covers the zone shown by the right facing arrow. I’m trying to look at the entirety of the zone as well as zoom into the most recent trend.
Price breaks through $3 to $5. comes back down to $3. This is where it gets interesting...
What do we see on the left volume profile? A massive amount of volume at the... $3 mark. This volume comes from the 2 weeks pointed out in the chart. I’ve moved this profile around found those are the 2 causing that, confirm for yourself if you want to see it. But what happens after? The price climbs to the previous resistance level.
Notice how it fakes out above this zone? This is market makers testing the market. Notice how the volume on that candle was not low? Notice on the right side how that is mostly selling pressure? Market makers found there is still too much selling to continue. They don’t want to fight against sellers. So what do they need to do to fix this? Get rid of the remaining selling pressure. How? Scare more sellers out of the stock and accumulate further. This is the story told by the right volume profile. They are pushing the stock down to the accumulation zone to scare the last of the sellers out. This is where we are now.
The question of "why do this?" tells us what will happen. They do this so when they try to move the stock up past the accumulation zone/resistance zone, they want no resistance, they want the price to rise to their target zone with no effort, they want the price to carry the momentum without their effort. They do this by scaring sellers out of the market. If there are no sellers left to push the stock down, it will rise effortlessly.
Once they believe they have scared us out of our positions, they will test the upper level again.
If the selling pressure there has disappeared, then the price will continue up. If the selling pressure is still there, we come back down and try again.
THE END.
Post story commentary.
I am currently learning about volume price analysis and practicing my new understanding. i could be very wrong but this is what I see and how I read it.
I would love to hear your opinions and please judge me. I’m here to learn, not ready to teach.
I'm just an amateur trader who's read a few books.
Note
side note. back story is based off chart in DEFI not DEFT. Not IPO but start of the data.Looking at DEFT the volume in increasing and fast. I'm thinking next week will be explosive.

Disclaimer
The information and publications are not meant to be, and do not constitute, financial, investment, trading, or other types of advice or recommendations supplied or endorsed by TradingView. Read more in the Terms of Use.
Disclaimer
The information and publications are not meant to be, and do not constitute, financial, investment, trading, or other types of advice or recommendations supplied or endorsed by TradingView. Read more in the Terms of Use.