
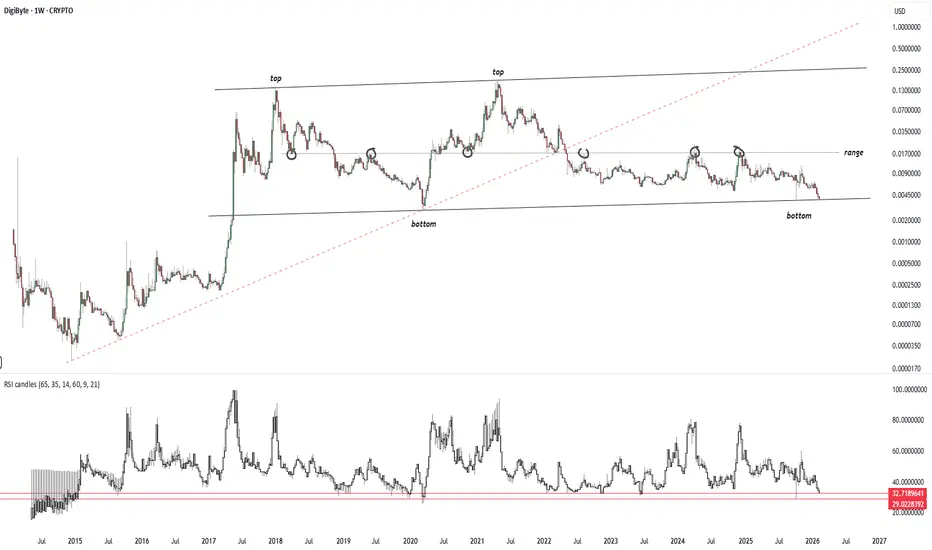
Technical Analysis: We are looking at the weekly chart of DigiByte (DGB), one of the longest-standing assets in the crypto space. The price action is currently respecting a massive decade-long parallel channel.
Macro Support Test: The price is currently testing the rising support trendline labeled "bottom". This specific trendline successfully marked the absolute bottoms in 2015 and 2020. We are at a historic pivot point.
RSI Alignment: The Weekly RSI is currently at 32, revisiting the exact same oversold zone that triggered the massive bull runs of the previous cycles. The confluence of price support and RSI capitulation is mathematically identical to historical bottoms.
Risk/Reward Ratio: Entering here offers an exceptional R/R setup. The invalidation level (break of the trendline) is very close, while the first major resistance (the dotted "range" line around 0.017) implies a potential 300-400% move from current levels just to test the mid-range.
Conclusion: While market sentiment ignores older generation coins ("Dino Coins"), the technical structure suggests DGB is at a maximum financial opportunity zone. This is a classic "Buy Support, Sell Resistance" setup on a macro scale
.

Follow me on X
x.com/Cryptollica
x.com/Cryptollica
Disclaimer
The information and publications are not meant to be, and do not constitute, financial, investment, trading, or other types of advice or recommendations supplied or endorsed by TradingView. Read more in the Terms of Use.
Follow me on X
x.com/Cryptollica
x.com/Cryptollica
Disclaimer
The information and publications are not meant to be, and do not constitute, financial, investment, trading, or other types of advice or recommendations supplied or endorsed by TradingView. Read more in the Terms of Use.