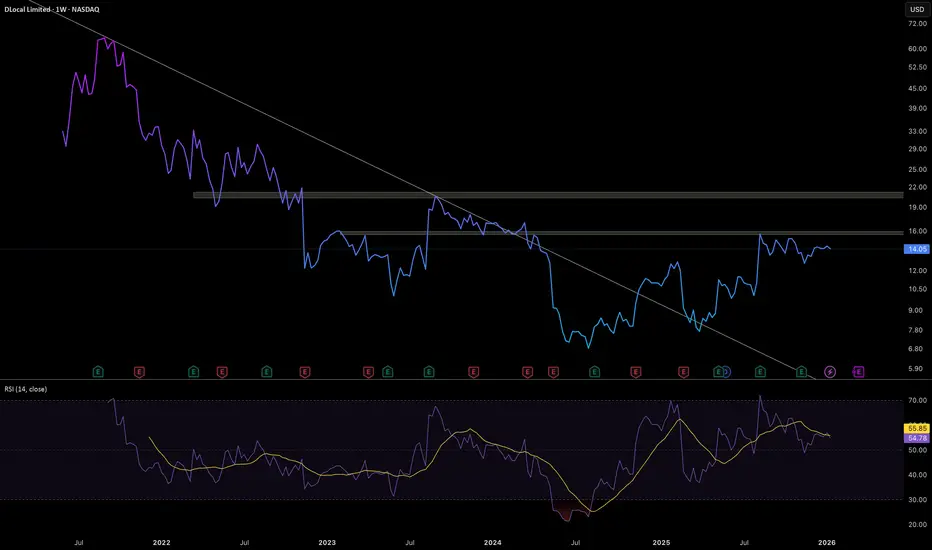
We are spotting a bull flag formation that was hidden by the messy wicks on the candle charts. This is why switching to a Line Chart is so powerful, it filters out the emotion and shows you the pure structure.
 DLO is in a continuation pattern, and the market seems to be just taking breath before replication its previous violent move.
After the pole phase, the RSI has dipped back to 54.78, and holding perfectly above 50.
The flag "activates" when the price line curls back up and breaks $15.50.
The flag fails only if the price line drops below the bottom of the pole's consolidation area, which is $13.
This chart confirms that the scary "Shooting Star" candle we saw earlier week was likely just noise. The structural trend still remains bullish.
DLO is in a continuation pattern, and the market seems to be just taking breath before replication its previous violent move.After the pole phase, the RSI has dipped back to 54.78, and holding perfectly above 50.
The flag "activates" when the price line curls back up and breaks $15.50.
The flag fails only if the price line drops below the bottom of the pole's consolidation area, which is $13.
This chart confirms that the scary "Shooting Star" candle we saw earlier week was likely just noise. The structural trend still remains bullish.

Disclaimer
The information and publications are not meant to be, and do not constitute, financial, investment, trading, or other types of advice or recommendations supplied or endorsed by TradingView. Read more in the Terms of Use.
Disclaimer
The information and publications are not meant to be, and do not constitute, financial, investment, trading, or other types of advice or recommendations supplied or endorsed by TradingView. Read more in the Terms of Use.