
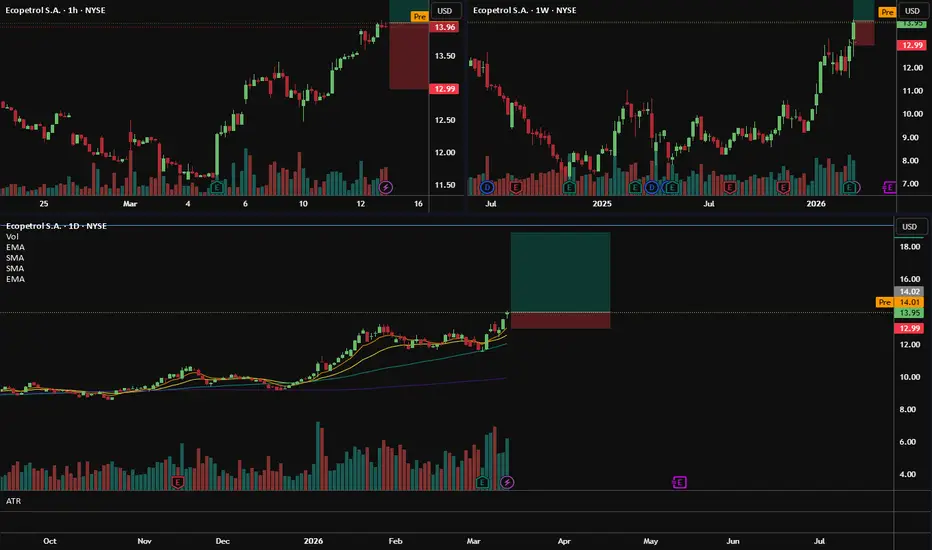
💰 EC — Swing Trade Idea
(Ecopetrol S.A.)
🏢 Company Snapshot
• Integrated oil & gas producer and the largest energy company in Colombia with upstream, refining, and transport assets.
• The stock is gaining momentum alongside strengthening crude prices and renewed capital flows into global energy equities.
• Price is pressing into a multi-month breakout zone after a sustained base and trend reversal.
📊 Fundamental Context (Trade-Relevant Only)
• Valuation: Trades at a discount to most global integrated oil peers on forward earnings and P/B metrics.
• Balance Sheet: Manageable leverage with improving debt profile following prior deleveraging cycles.
• Cash Flow: Strongly tied to oil prices; recent commodity strength supports expanding operating cash flow.
• Dividend: High yield historically acts as a structural demand floor during pullbacks.
Fundamental Read:
Discount valuation combined with improving oil sentiment supports continuation of the structural uptrend.
🪙 Industry & Sector Backdrop
• Short-Term (1–4 weeks): Energy equities showing renewed relative strength as crude stabilizes and rotates back into favor.
• Medium-Term (1–6 months): Energy has begun outperforming broad indices following a long consolidation period.
• Macro Influence: Oil price momentum and geopolitical supply risks support sector upside volatility.
Sector Bias: Bullish
📐 Technical Structure (Primary Driver)
• Trend: Price firmly above both the 50-SMA and 200-SMA, confirming a mature trend reversal.
• Momentum: Momentum expansion following a short consolidation; indicators resetting before continuation.
• Pattern: Bullish continuation after breakout from multi-month base, now forming a controlled trend staircase.
• Volume: Rising participation during impulsive moves suggests accumulation rather than distribution.
Key Levels
• Support: 13.20 – 13.50 (recent breakout base + short-term trend support)
• Resistance: 14.10 – 14.30 (near-term breakout trigger)
• Major Resistance: 17.80 – 18.00 (weekly structure target)
🎯 Trade Plan (Execution-Focused)
• Entry: 13.70 – 14.10
Pullback into breakout retest or continuation through current compression.
• Stop: 12.99
Below structural support and trend invalidation.
• Target: 18.00
Weekly resistance and measured move from the base breakout.
• Risk-to-Reward: ≈ 2.8R
Alternate Scenario
If price fails to hold 13.50 and breaks 12.99, the breakout becomes a failed continuation and probability shifts toward a deeper retracement into the 12.20–12.50 demand zone.
🧠 Swing Trader’s Bias
Price is trending cleanly above the 50-SMA after breaking a multi-month base with expanding momentum. The preferred setup is either a shallow pullback into the 13.70 area or continuation through 14.10 targeting the weekly resistance near 18. Failure below 12.99 invalidates the trend continuation thesis.
(Ecopetrol S.A.)
🏢 Company Snapshot
• Integrated oil & gas producer and the largest energy company in Colombia with upstream, refining, and transport assets.
• The stock is gaining momentum alongside strengthening crude prices and renewed capital flows into global energy equities.
• Price is pressing into a multi-month breakout zone after a sustained base and trend reversal.
📊 Fundamental Context (Trade-Relevant Only)
• Valuation: Trades at a discount to most global integrated oil peers on forward earnings and P/B metrics.
• Balance Sheet: Manageable leverage with improving debt profile following prior deleveraging cycles.
• Cash Flow: Strongly tied to oil prices; recent commodity strength supports expanding operating cash flow.
• Dividend: High yield historically acts as a structural demand floor during pullbacks.
Fundamental Read:
Discount valuation combined with improving oil sentiment supports continuation of the structural uptrend.
🪙 Industry & Sector Backdrop
• Short-Term (1–4 weeks): Energy equities showing renewed relative strength as crude stabilizes and rotates back into favor.
• Medium-Term (1–6 months): Energy has begun outperforming broad indices following a long consolidation period.
• Macro Influence: Oil price momentum and geopolitical supply risks support sector upside volatility.
Sector Bias: Bullish
📐 Technical Structure (Primary Driver)
• Trend: Price firmly above both the 50-SMA and 200-SMA, confirming a mature trend reversal.
• Momentum: Momentum expansion following a short consolidation; indicators resetting before continuation.
• Pattern: Bullish continuation after breakout from multi-month base, now forming a controlled trend staircase.
• Volume: Rising participation during impulsive moves suggests accumulation rather than distribution.
Key Levels
• Support: 13.20 – 13.50 (recent breakout base + short-term trend support)
• Resistance: 14.10 – 14.30 (near-term breakout trigger)
• Major Resistance: 17.80 – 18.00 (weekly structure target)
🎯 Trade Plan (Execution-Focused)
• Entry: 13.70 – 14.10
Pullback into breakout retest or continuation through current compression.
• Stop: 12.99
Below structural support and trend invalidation.
• Target: 18.00
Weekly resistance and measured move from the base breakout.
• Risk-to-Reward: ≈ 2.8R
Alternate Scenario
If price fails to hold 13.50 and breaks 12.99, the breakout becomes a failed continuation and probability shifts toward a deeper retracement into the 12.20–12.50 demand zone.
🧠 Swing Trader’s Bias
Price is trending cleanly above the 50-SMA after breaking a multi-month base with expanding momentum. The preferred setup is either a shallow pullback into the 13.70 area or continuation through 14.10 targeting the weekly resistance near 18. Failure below 12.99 invalidates the trend continuation thesis.

ClearPoint Trading 🎯
Indicators • Education • Execution
whop.com/clearpointtrading | discord.gg/8sEwMnpz
Indicators • Education • Execution
whop.com/clearpointtrading | discord.gg/8sEwMnpz
Disclaimer
The information and publications are not meant to be, and do not constitute, financial, investment, trading, or other types of advice or recommendations supplied or endorsed by TradingView. Read more in the Terms of Use.
ClearPoint Trading 🎯
Indicators • Education • Execution
whop.com/clearpointtrading | discord.gg/8sEwMnpz
Indicators • Education • Execution
whop.com/clearpointtrading | discord.gg/8sEwMnpz
Disclaimer
The information and publications are not meant to be, and do not constitute, financial, investment, trading, or other types of advice or recommendations supplied or endorsed by TradingView. Read more in the Terms of Use.