
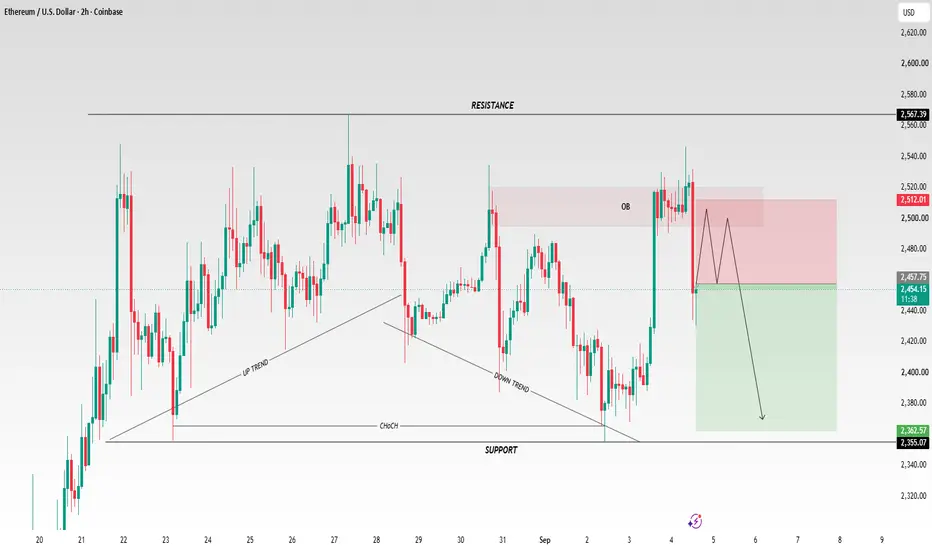
🔥 ETH/USD — 2H PROFESSIONAL TECHNICAL ANALYSIS
📉 Bearish Rejection from Order Block | Potential Move Toward Support
ETH/USD is currently trading around 2,456, and the 2H chart is showing an important reaction from the marked Order Block / supply zone around 2,495–2,515.
After the recent bullish impulse, price pushed into the supply area and failed to maintain the higher levels. The current structure therefore gives a bearish setup, but confirmation is important before considering the downside move.
🧠 MARKET STRUCTURE
The chart shows a previous uptrend followed by a shift toward a more corrective structure.
Price initially respected the rising trendline and pushed higher, but later broke the structure and formed a downtrend toward the 2,355–2,365 support region.
From that support, ETH produced a strong bullish recovery and returned toward the previous supply area.
This makes the current zone particularly important:
📌 Supply / Order Block: 2,495–2,515
📌 Major Resistance: 2,567
📌 Current Price: ~2,456
📌 Major Support: 2,355–2,365
🔴 BEARISH SCENARIO
The preferred setup shown on the chart is a sell-on-retest idea.
If ETH moves back into the 2,495–2,515 Order Block and shows rejection, sellers could regain control.
A rejection from this zone could potentially create a move toward:
🎯 TP1: 2,440
🎯 TP2: 2,400
🎯 TP3: 2,365
The 2,355–2,365 area is the major support zone and would be the key downside objective shown by the chart.
📍 ENTRY & INVALIDATION
Potential Sell Zone:
🔻 2,495 – 2,515
Confirmation:
Wait for bearish rejection/weakness inside the zone rather than entering solely because price reaches it.
Invalidation:
⚠️ A strong breakout and sustained acceptance above approximately 2,515–2,520 would weaken the immediate bearish setup.
A larger bullish breakout above 2,567 would further invalidate the bearish structure shown on this chart.
🟢 SUPPORT ZONE
The 2,355–2,365 region is the most important support visible on the chart.
If price reaches this area, traders should watch the reaction carefully because previous price action indicates strong demand around this level.
A clean breakdown below support could open the door for further downside, while a strong bullish reaction could produce another recovery.
🔑 KEY LEVELS
Level Importance
2,567 🔴 Major Resistance
2,495–2,515 🔴 Order Block / Supply
2,456 ⚪ Current Price Area
2,440 🟡 Potential TP1
2,400 🟡 Potential TP2
2,355–2,365 🟢 Major Support / TP3
📈 ALTERNATIVE BULLISH SCENARIO
The bearish idea should not be treated as guaranteed.
If ETH breaks above the 2,495–2,515 supply zone with strong momentum and successfully holds above it, the bearish setup becomes weaker.
A sustained move above the marked resistance could instead indicate continuation toward the 2,567 resistance area.
Therefore, the key decision zone remains 2,495–2,515.
🧾 FINAL CHART IDEA
ETH/USD is approaching a critical supply zone. A rejection from 2,495–2,515 could favor a bearish move toward 2,440 → 2,400 → 2,365. A strong breakout above the supply zone would invalidate the immediate bearish scenario and shift focus toward 2,567 resistance.

✦ MARKET STRATEGY SIGNALS ✦ 📊
Smart Money • Price Action • Precision • good entries
📲 Join Telegram: t.me/marketstrategyentry
Smart Money • Price Action • Precision • good entries
📲 Join Telegram: t.me/marketstrategyentry
Related publications
Disclaimer
The information and publications are not meant to be, and do not constitute, financial, investment, trading, or other types of advice or recommendations supplied or endorsed by TradingView. Read more in the Terms of Use.