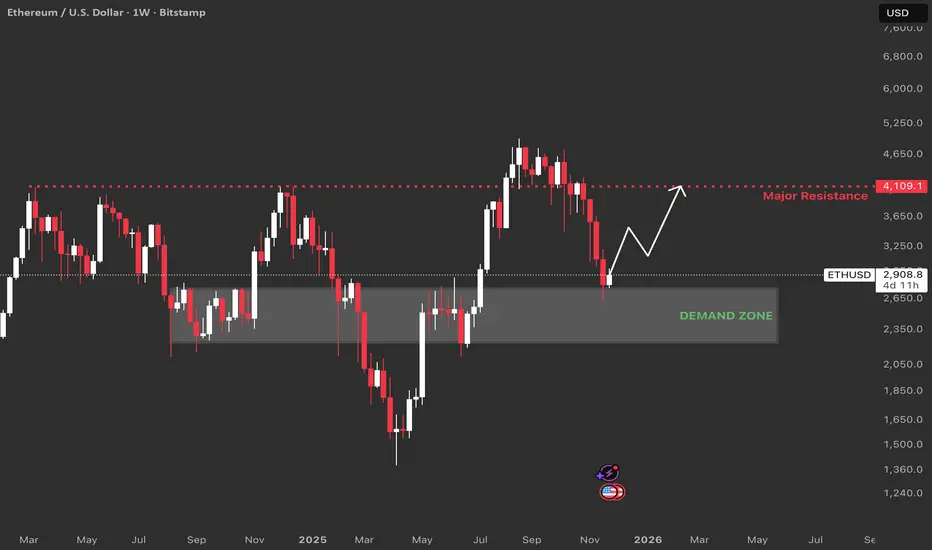
Demand Zone: This area marks where ETH found buyers over multiple months, rejecting further declines. Historically, when price revisits this zone after a sell-off, it tends to bounce. The recent reaction confirms buyers are active and defending this level.
Major Resistance (4,109 USD): It shows a prior weekly high and an expected supply or resistance area. This level also aligns with a golden pocket Fibb level, making it a confluence point where sellers could re-enter or bulls take profits.
Invalidation point: Weekly close below demand zone or multiple rejections with lower highs near demand.
Disclaimer
The information and publications are not meant to be, and do not constitute, financial, investment, trading, or other types of advice or recommendations supplied or endorsed by TradingView. Read more in the Terms of Use.
Disclaimer
The information and publications are not meant to be, and do not constitute, financial, investment, trading, or other types of advice or recommendations supplied or endorsed by TradingView. Read more in the Terms of Use.