Trend: Bearish
Structure: Break of Structure confirmed – Redistribution Phase
Date: October 22, 2025
🧭 Technical Overview
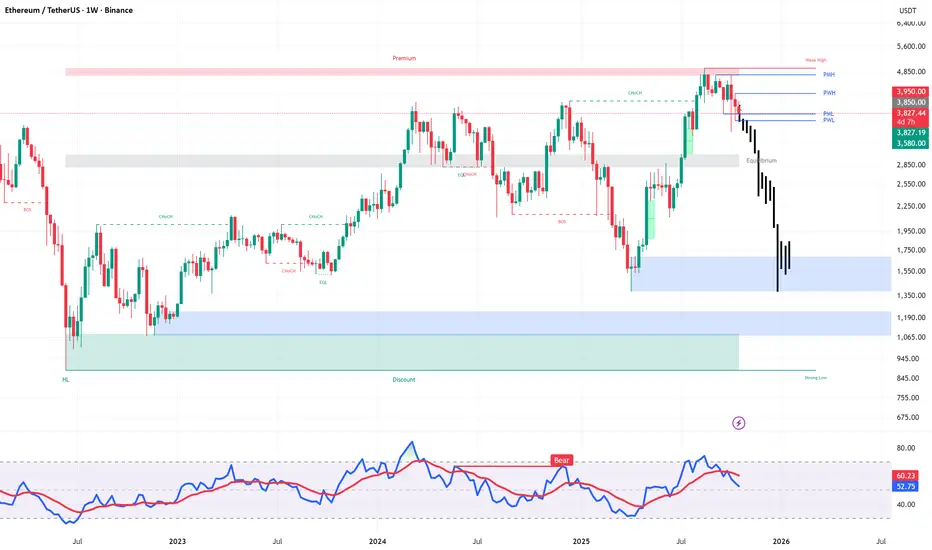
Ethereum rejected from the premium zone (3,850–3,950) after forming a weak high.
The market confirmed a Break of Structure (BOS) below the previous weekly low and is now trading inside a discount zone.
The projected black path shows a possible move down toward 1,550–1,600, followed by a short-term rebound toward 2,200–2,400, before potential continuation of the downtrend — unless a clear structural shift occurs.
📊 Key Levels
Premium Supply Zone: 3,850–3,950 → strong resistance
Equilibrium: 2,700 → now acts as resistance
Discount Demand Zone: 1,450–1,600 → potential rebound area
Strong Low: 900 → break = long-term bearish continuation
⚙️ RSI & Momentum
RSI (Weekly) remains below 50 with a recent bearish crossover, confirming downward momentum.
No clear bullish divergence yet.
🧠 My Outlook
✅ Base Scenario (≈70%)
Price continues falling toward 1,550–1,600, reacts bullishly, and corrects to 2,200–2,400 before likely resuming the downtrend.
⚠️ Alternative Scenario (≈30%)
If 1,550 fails to hold, next key support lies around 1,180–1,250.
Bullish reversal only confirmed if weekly candle closes above 3,950.
📝 Summary
ETH is still bearish in the weekly structure.
I’ll look for liquidity sweeps or CHoCH signals near 1,550 to consider long positions.
Until then, selling rallies remains the preferred strategy.
#ETHUSDT #Ethereum #CryptoAnalysis #SmartMoneyConcepts #TechnicalAnalysis #PriceAction
🔹 تحلیل هفتگی اتریوم (ETHUSDT)
روند: نزولی
ساختار: تأیید شکست ساختار (BOS) – فاز بازتوزیع
تاریخ: ۲۲ اکتبر ۲۰۲۵
🧭 نمای کلی
اتریوم پس از برخورد به ناحیهی پریمیوم ۳۸۵۰ تا ۳۹۵۰ و تشکیل سقف ضعیف، وارد فاز نزولی شد.
بازار با شکست کف قبلی در تایم هفتگی (BOS) اکنون در محدودهی دیسکانت (Discount Zone) در حال نوسان است.
مسیر مشکی در چارت نشاندهندهی حرکت محتمل قیمت به سمت ۱۶۰۰–۱۵۵۰ دلار و سپس بازگشت موقت تا ناحیهی ۲۴۰۰–۲۲۰۰ دلار است، پیش از آنکه روند نزولی دوباره ادامه پیدا کند (مگر اینکه ساختار بهطور واضح تغییر کند).
📊 نواحی کلیدی
ناحیهی عرضه پریمیوم: ۳۹۵۰–۳۸۵۰ دلار (مقاومت قوی)
نقطهی تعادل (Equilibrium): حدود ۲۷۰۰ دلار (مقاومت جدید)
ناحیهی تقاضای دیسکانت: ۱۶۰۰–۱۴۵۰ دلار (احتمال واکنش صعودی)
کف قوی: ۹۰۰ دلار (در صورت شکست → نزول بلندمدت)
⚙️ مومنتوم و RSI
RSI هفتگی زیر سطح ۵۰ است و کراس نزولی داده؛ یعنی مومنتوم فروش هنوز فعال است.
در حال حاضر واگرایی صعودی خاصی دیده نمیشود.
🧠 چشمانداز
✅ سناریوی اصلی (احتمال ۷۰٪):
ادامهی نزول تا محدودهی ۱۵۵۰–۱۶۰۰ و سپس ریباند تا ۲۲۰۰–۲۴۰۰ دلار.
⚠️ سناریوی جایگزین (احتمال ۳۰٪):
در صورت شکست محدودهی ۱۵۵۰، تارگت بعدی ناحیهی ۱۲۵۰–۱۱۸۰ دلار است.
تغییر روند فقط با بستهشدن کندل هفتگی بالای ۳۹۵۰ تأیید میشود.
📝 جمعبندی
ساختار بلندمدت اتریوم همچنان نزولی است.
تا زمانی که نشانههای جذب نقدینگی یا CHoCH صعودی در محدودهی ۱۵۵۰ دیده نشود، استراتژی ترجیحی فروش در مقاومتهاست.
#اتریوم #تحلیل_تکنیکال #اسمارت_مانی #کریپتو #Ethereum #ETHUSDT
Structure: Break of Structure confirmed – Redistribution Phase
Date: October 22, 2025
🧭 Technical Overview
Ethereum rejected from the premium zone (3,850–3,950) after forming a weak high.
The market confirmed a Break of Structure (BOS) below the previous weekly low and is now trading inside a discount zone.
The projected black path shows a possible move down toward 1,550–1,600, followed by a short-term rebound toward 2,200–2,400, before potential continuation of the downtrend — unless a clear structural shift occurs.
📊 Key Levels
Premium Supply Zone: 3,850–3,950 → strong resistance
Equilibrium: 2,700 → now acts as resistance
Discount Demand Zone: 1,450–1,600 → potential rebound area
Strong Low: 900 → break = long-term bearish continuation
⚙️ RSI & Momentum
RSI (Weekly) remains below 50 with a recent bearish crossover, confirming downward momentum.
No clear bullish divergence yet.
🧠 My Outlook
✅ Base Scenario (≈70%)
Price continues falling toward 1,550–1,600, reacts bullishly, and corrects to 2,200–2,400 before likely resuming the downtrend.
⚠️ Alternative Scenario (≈30%)
If 1,550 fails to hold, next key support lies around 1,180–1,250.
Bullish reversal only confirmed if weekly candle closes above 3,950.
📝 Summary
ETH is still bearish in the weekly structure.
I’ll look for liquidity sweeps or CHoCH signals near 1,550 to consider long positions.
Until then, selling rallies remains the preferred strategy.
#ETHUSDT #Ethereum #CryptoAnalysis #SmartMoneyConcepts #TechnicalAnalysis #PriceAction
🔹 تحلیل هفتگی اتریوم (ETHUSDT)
روند: نزولی
ساختار: تأیید شکست ساختار (BOS) – فاز بازتوزیع
تاریخ: ۲۲ اکتبر ۲۰۲۵
🧭 نمای کلی
اتریوم پس از برخورد به ناحیهی پریمیوم ۳۸۵۰ تا ۳۹۵۰ و تشکیل سقف ضعیف، وارد فاز نزولی شد.
بازار با شکست کف قبلی در تایم هفتگی (BOS) اکنون در محدودهی دیسکانت (Discount Zone) در حال نوسان است.
مسیر مشکی در چارت نشاندهندهی حرکت محتمل قیمت به سمت ۱۶۰۰–۱۵۵۰ دلار و سپس بازگشت موقت تا ناحیهی ۲۴۰۰–۲۲۰۰ دلار است، پیش از آنکه روند نزولی دوباره ادامه پیدا کند (مگر اینکه ساختار بهطور واضح تغییر کند).
📊 نواحی کلیدی
ناحیهی عرضه پریمیوم: ۳۹۵۰–۳۸۵۰ دلار (مقاومت قوی)
نقطهی تعادل (Equilibrium): حدود ۲۷۰۰ دلار (مقاومت جدید)
ناحیهی تقاضای دیسکانت: ۱۶۰۰–۱۴۵۰ دلار (احتمال واکنش صعودی)
کف قوی: ۹۰۰ دلار (در صورت شکست → نزول بلندمدت)
⚙️ مومنتوم و RSI
RSI هفتگی زیر سطح ۵۰ است و کراس نزولی داده؛ یعنی مومنتوم فروش هنوز فعال است.
در حال حاضر واگرایی صعودی خاصی دیده نمیشود.
🧠 چشمانداز
✅ سناریوی اصلی (احتمال ۷۰٪):
ادامهی نزول تا محدودهی ۱۵۵۰–۱۶۰۰ و سپس ریباند تا ۲۲۰۰–۲۴۰۰ دلار.
⚠️ سناریوی جایگزین (احتمال ۳۰٪):
در صورت شکست محدودهی ۱۵۵۰، تارگت بعدی ناحیهی ۱۲۵۰–۱۱۸۰ دلار است.
تغییر روند فقط با بستهشدن کندل هفتگی بالای ۳۹۵۰ تأیید میشود.
📝 جمعبندی
ساختار بلندمدت اتریوم همچنان نزولی است.
تا زمانی که نشانههای جذب نقدینگی یا CHoCH صعودی در محدودهی ۱۵۵۰ دیده نشود، استراتژی ترجیحی فروش در مقاومتهاست.
#اتریوم #تحلیل_تکنیکال #اسمارت_مانی #کریپتو #Ethereum #ETHUSDT
Disclaimer
The information and publications are not meant to be, and do not constitute, financial, investment, trading, or other types of advice or recommendations supplied or endorsed by TradingView. Read more in the Terms of Use.
Disclaimer
The information and publications are not meant to be, and do not constitute, financial, investment, trading, or other types of advice or recommendations supplied or endorsed by TradingView. Read more in the Terms of Use.