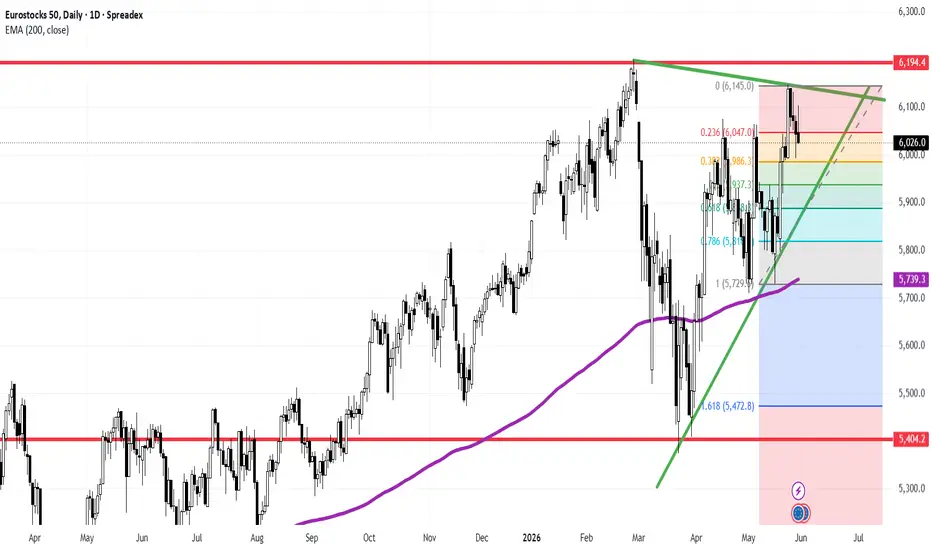
The Euro Stoxx 50 Index ( SX5E / EU50) is presenting a clean technical corrective structure on the Daily Chart, drifting lower toward a well-defined confluence zone where buyers are expected to re-emerge.
Following a strong bullish expansion, the index is experiencing a healthy mean-reversion phase, offering a highly readable environment for swing traders tracking European benchmarks.
### Key Technical Factors:
* **The Aggressive Ascending Trendline (LTA):** A steep green support line is climbing rapidly, acting as the immediate dynamic floor for the medium-term bullish momentum.
* **The Fibonacci Retraction Framework:** Drawn from the recent structural swing, the price is currently battling near the **0.236 Fibonacci level (6,047.0)**. A minor extension lower points directly to a test of the **0.382 level (5,986.3)**, which perfectly intersects with the rising LTA.
* **The Macro Support & EMA 200:** Should the corrective phase accelerate, a massive structural floor is located lower at the **1.0 Fibonacci level (5,729.0)**. This static level aligns seamlessly with the long-term **200-period Exponential Moving Average (EMA 200 - purple line at 5,739.3)**.
* **Overhead Target Wall (6,194.4):** The historical macro resistance remains firmly established at the **6,194.4** horizontal red line.
### Strategic Scenario & Execution Plan:
The dashed trajectory line on the chart illustrates a classic technical retest sequence:
1. **The Downside Drift:** Short-term selling pressure is leading the price to interact with the intersection of the green LTA and the internal Fibonacci retracements (between 6,047 and 5,986).
2. **The Bullish Reaction:** Because this area represents a structural cluster, it is a high-probability zone for buyer absorption. A clean hold here opens the path to target a retest of the major 6,194.4 overhead resistance wall.
We will monitor lower timeframes (such as H4 or H1) as the price enters this confluence zone, looking for deceleration signs or a structural shift (CHoCH) to define a tight, low-risk long entry.
---
📊 **ProData Chart** | By Rogerio Zaglia
*12+ years of daily global market technical analysis.*
⚠️ **Disclaimer:** This analysis is for educational and informational purposes only. It does not constitute financial advice or an investment recommendation. Past performance is not indicative of future results.
SX5E / EU50) is presenting a clean technical corrective structure on the Daily Chart, drifting lower toward a well-defined confluence zone where buyers are expected to re-emerge.Following a strong bullish expansion, the index is experiencing a healthy mean-reversion phase, offering a highly readable environment for swing traders tracking European benchmarks.
### Key Technical Factors:
* **The Aggressive Ascending Trendline (LTA):** A steep green support line is climbing rapidly, acting as the immediate dynamic floor for the medium-term bullish momentum.
* **The Fibonacci Retraction Framework:** Drawn from the recent structural swing, the price is currently battling near the **0.236 Fibonacci level (6,047.0)**. A minor extension lower points directly to a test of the **0.382 level (5,986.3)**, which perfectly intersects with the rising LTA.
* **The Macro Support & EMA 200:** Should the corrective phase accelerate, a massive structural floor is located lower at the **1.0 Fibonacci level (5,729.0)**. This static level aligns seamlessly with the long-term **200-period Exponential Moving Average (EMA 200 - purple line at 5,739.3)**.
* **Overhead Target Wall (6,194.4):** The historical macro resistance remains firmly established at the **6,194.4** horizontal red line.
### Strategic Scenario & Execution Plan:
The dashed trajectory line on the chart illustrates a classic technical retest sequence:
1. **The Downside Drift:** Short-term selling pressure is leading the price to interact with the intersection of the green LTA and the internal Fibonacci retracements (between 6,047 and 5,986).
2. **The Bullish Reaction:** Because this area represents a structural cluster, it is a high-probability zone for buyer absorption. A clean hold here opens the path to target a retest of the major 6,194.4 overhead resistance wall.
We will monitor lower timeframes (such as H4 or H1) as the price enters this confluence zone, looking for deceleration signs or a structural shift (CHoCH) to define a tight, low-risk long entry.
---
📊 **ProData Chart** | By Rogerio Zaglia
*12+ years of daily global market technical analysis.*
⚠️ **Disclaimer:** This analysis is for educational and informational purposes only. It does not constitute financial advice or an investment recommendation. Past performance is not indicative of future results.

Disclaimer
The information and publications are not meant to be, and do not constitute, financial, investment, trading, or other types of advice or recommendations supplied or endorsed by TradingView. Read more in the Terms of Use.
Disclaimer
The information and publications are not meant to be, and do not constitute, financial, investment, trading, or other types of advice or recommendations supplied or endorsed by TradingView. Read more in the Terms of Use.