Why Technical Analysis is enough to make profits in financial maif you only looked at charts and bought NVDA at 0.61 Fibonacci Retracement, you would be able to 8X your money. Yo don't need to look at any industry trends regarding AI or whatever. You don't need to look at balance sheet, cash flow or any other thing. If the information is important , you will be
0.96USD
84.00 MUSD
817.16 MUSD
81.18 M
About Everi Holdings Inc.
Sector
Industry
CEO
Randy L Taylor
Website
Headquarters
Las Vegas
Employees (FY)
2.2 K
Founded
2004
ISIN
US30034T1034
FIGI
BBG000H1B407
Everi Holdings, Inc. engages in the provision of technology solutions to the casino, interactive, and gaming industry. It operates through the Games and Financial Technology Solutions (FinTech) segments. The Games segment focuses on leased gaming equipment, sales of gaming equipment, gaming systems, interactive solutions, and ancillary products and services. The FinTech segment provides access to cash at gaming facilities via ATM cash withdrawals, credit card cash access transactions and point of sale debit card cash access transactions, check-related services, fully integrated kiosks and maintenance services, compliance, audit and data software, casino credit data, and reporting services and other ancillary offerings. The company was founded on February 4, 2004 and is headquartered in Las Vegas, NV.

Inverted Head and ShoulderSeems that a head and shoulder pattern has formed. although quite pointy shoulders.
The volume at the 'head' is more than twice the average.
The entry is as indicated which is later in order to confirm direction.
The target to reach is before the next earnings.

$EVRI Stage 1 Cup Base SetupQuite a few casino related stocks starting to setup.
$EVRI is one with stage 1 cup.
Still a bit loose on that cheat pivot and reporting earnings tomorrow morning.
Will be watching how it reacts.

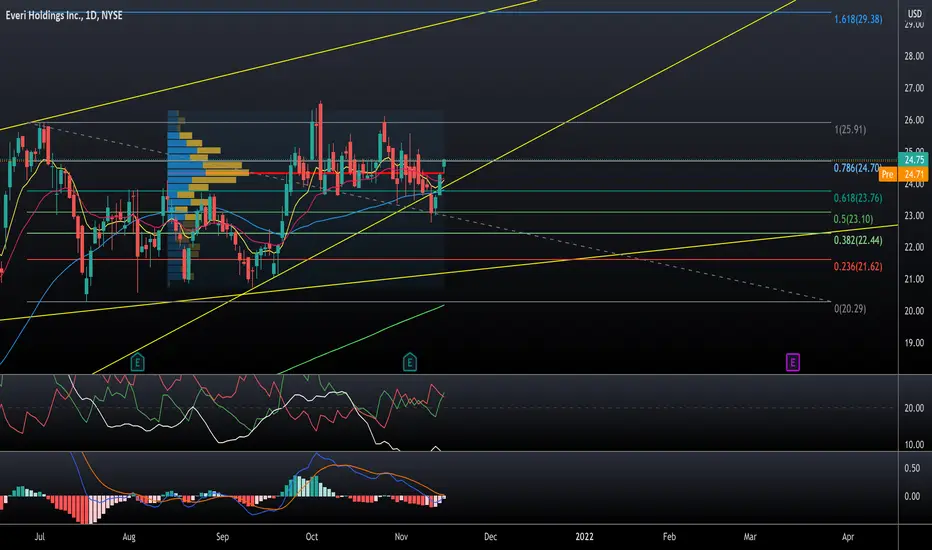
EVRI Long SwingEVRI has been consolidating since late September. It failed to break the 1 Fibonacci level on 4 occasions and retraced to the .5 level.
The current price is just above the POC line (90 days) and closed just above the .78 fibonacci level and well above its up trend line.
The MACD is about to cros
$EVRI Possible Reversal RecoveryDon't like that wide range black bar pullback to breakout support on $EVRI but it might be staging a reversal recovery here. Looks like it wants to burst out.

LONG - EVRIGoing through the 5 chart elements theres a lot I like about this stock. What's not showing is the quarterly increase in sales (-18%, +23%, +346%) + increasing no# of funds invested (268/273/334/341)

$EVRI Pullback Setup to Breakout Support$EVRI has one of the best looking setups out there especially in a market that's correcting.
Clear rectangle breakout and now gentle 3 days pullback to rectangle breakout support.
Top stock to watch tomorrow.

$EVRI basing at its 50 MA$EVRI basing at its 50 MA after a 94% rally. Clear horizontal level. Looks promising for this week.

Everi Digital Announces New Contract with BCLC to Provide Slot CEVRI: Everi Holdings Inc.
2021-04-19 08:00:00
Everi Digital Announces New Contract with BCLC to Provide Slot Content for PlayNow.com Online Casino

Easy moneyEvery time price has broken broken this uptrend it has resulted in perfect buy/sell opportunity. Looking to hit 14.50 next.

See all ideas
Trade directly on the supercharts through our supported, fully-verified and user-reviewed brokers.


Curated watchlists where EVRI is featured.

Frequently Asked Questions
The current price of EVRI is 8.89 USD — it has increased by 1.48% in the past 24 hours.
Depending on the exchange, the stock ticker may vary. For instance, on NYSE exchange Everi Holdings Inc. stocks are traded under the ticker EVRI.
Everi Holdings Inc. is going to release the next earnings report on May 8, 2024. Keep track of upcoming events with our Earnings Calendar.
EVRI stock is 2.30% volatile and has beta coefficient of 1.39. Check out the list of the most volatile stocks — is Everi Holdings Inc. there?
One year price forecast for Everi Holdings Inc. has a max estimate of 16.00 USD and a min estimate of 12.00 USD.
EVRI earnings for the last quarter are 0.29 USD whereas the estimation was 0.24 USD which accounts for 20.02% surprise. Estimated earnings for the next quarter are 0.20 USD. See more details about Everi Holdings Inc. earnings.
Everi Holdings Inc. revenue for the last quarter amounts to 206.60 M USD despite the estimated figure of 208.97 M USD. In the next quarter revenue is expected to reach 201.36 M USD.
Yes, you can track Everi Holdings Inc. financials in yearly and quarterly reports right on TradingView.
EVRI stock has fallen by 4.51% compared to the previous week, the month change is a 0.89% fall, over the last year Everi Holdings Inc. has showed a 45.79% decrease.
EVRI net income for the last quarter is 1.89 M USD, while the quarter before that showed 26.64 M USD of net income which accounts for −92.90% change. Track more Everi Holdings Inc. financial stats to get the full picture.
Today Everi Holdings Inc. has the market capitalization of 733.90 M, it has decreased by 2.17% over the last week.
No, EVRI doesn't pay any dividends to its shareholders. But don't worry, we've prepared a list of high-dividend stocks for you.
Like other stocks, EVRI shares are traded on stock exchanges, e.g. Nasdaq, Nyse, Euronext, and the easiest way to buy them is through an online stock broker. To do this, you need to open an account and follow a broker's procedures, then start trading. You can trade Everi Holdings Inc. stock right from TradingView charts — choose your broker and connect to your account.
As of Apr 18, 2024, the company has 2.20 K employees. See our rating of the largest employees — is Everi Holdings Inc. on this list?
Investing in stocks requires a comprehensive research: you should carefully study all the available data, e.g. company's financials, related news, and its technical analysis. So Everi Holdings Inc. technincal analysis shows the sell today, and its 1 week rating is strong sell. Since market conditions are prone to changes, it's worth looking a bit further into the future — according to the 1 month rating Everi Holdings Inc. stock shows the sell signal. See more of Everi Holdings Inc. technicals for a more comprehensive analysis.
If you're still not sure, try looking for inspiration in our curated watchlists.
If you're still not sure, try looking for inspiration in our curated watchlists.
We've gathered analysts' opinions on Everi Holdings Inc. future price: according to them, EVRI price has a max estimate of 16.00 USD and a min estimate of 12.00 USD. Read a more detailed Everi Holdings Inc. forecast: see what analysts think of Everi Holdings Inc. and suggest that you do with its stocks.
EBITDA measures a company's operating performance, its growth signifies an improvement in the efficiency of a company. Everi Holdings Inc. EBITDA is 343.39 M USD, and current EBITDA margin is 42.02%. See more stats in Everi Holdings Inc. financial statements.