
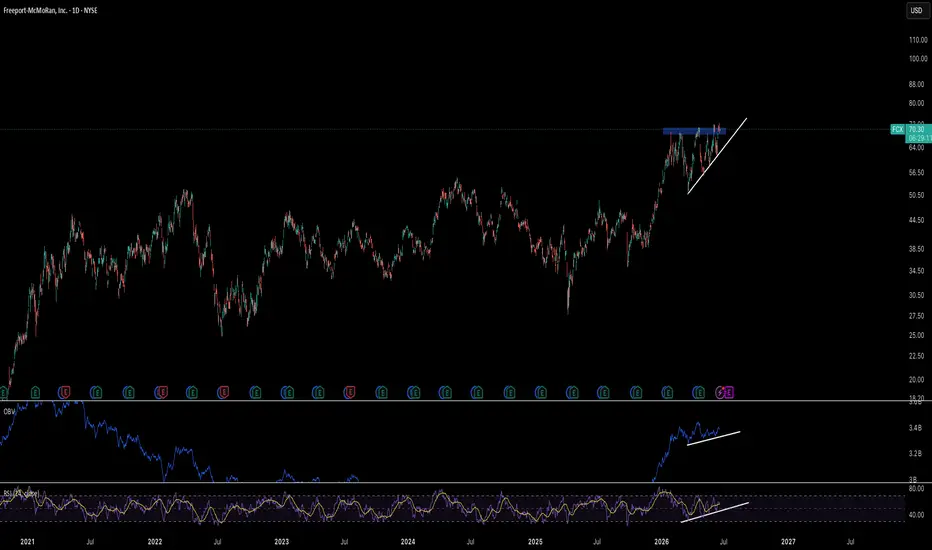
Looking at the charts for FCX today and we can see that we have a huge long term sideways price action over the past 20 years. We're the current price is looks like a steady increase in volume and a build up on the RSI.
I'm expecting that we might see another retracement, but ultimately building towards a strong breakout.
Watch this chart. I don't have a price target, but the move could be quite long and strong.
I'm expecting that we might see another retracement, but ultimately building towards a strong breakout.
Watch this chart. I don't have a price target, but the move could be quite long and strong.

Disclaimer
The information and publications are not meant to be, and do not constitute, financial, investment, trading, or other types of advice or recommendations supplied or endorsed by TradingView. Read more in the Terms of Use.
Disclaimer
The information and publications are not meant to be, and do not constitute, financial, investment, trading, or other types of advice or recommendations supplied or endorsed by TradingView. Read more in the Terms of Use.