
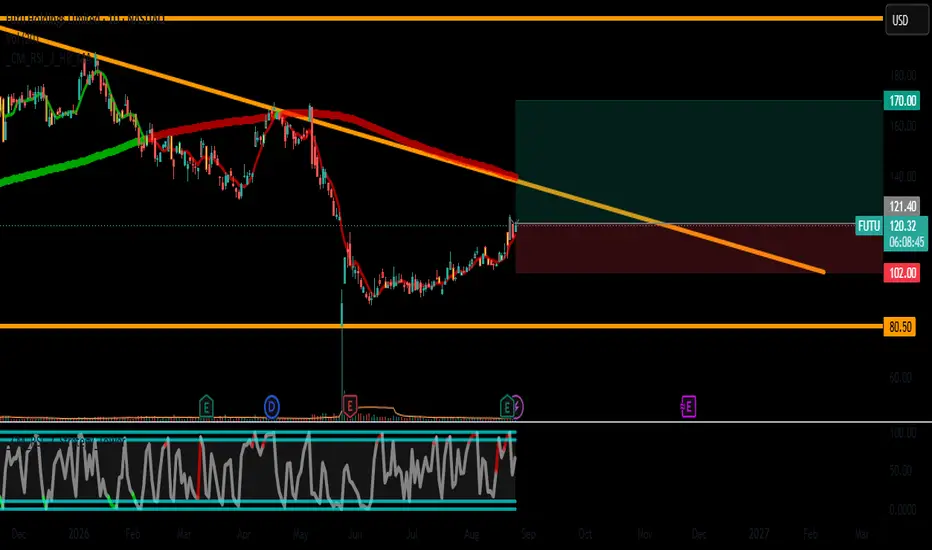
Ticker: FUTU (NASDAQ)
Strategy: Swing Trading (2–6 weeks)
Entry: $121.00
**Stop Loss:** $102.00 (-15.7%)
Take Profit: $170.00 (+40.5%)
Risk/Reward: ~2.58:1
Thesis
FUTU corrected -6.33% on Aug 24 ($123.64 → $115.81) after blowout Q2 earnings that beat revenue by +$150M and EPS by +12.9%. The dip retested the post-earnings gap and found support near $115, aligning with the rising SMA20 ($107.45). This is a classic "gap-and-retest" continuation setup.
Fundamental Drivers
Q2 revenue +35.7% YoY, net income +41.8% YoY. Trading volume surged +78.8%, funded clients +252K (+23.7% YoY) to 3.84M total. International clients now ~60% of total; Malaysia reached operational break-even. Consensus: 18 analysts rate "Strong Buy" with average PT $161 (+39% upside). Top firms: Barclays ($200), BofA ($180), Morgan Stanley ($177). Valuation is cheap at ~11.5x P/E, with net profit projected to triple over 2026–2028.
Technical Setup
Daily RSI at 58.66 (neutral/bullish bias). MACD above signal line – buy signal active. Price holds above all major SMAs (20, 50, 200). Key resistance: $124.36 (post-earnings high), then $131.37. Key supports: $115 (recent low) and $107.45 (SMA20).
Entry Rationale
Entry at $121 captures the moment after the correction exhausts, with buyers stepping in to resume the uptrend.
Risk Management
Stop at $102 (below SMA20, giving room for volatility). Partial exit at $155 (close 50%), full exit at $170 (or trail stop). Risks: Q3 slowdown warning, China regulatory pressure, class-action lawsuit headlines.
⚠️ IMPORTANT DISCLAIMER
This is not financial advice. It is a personal trading idea based on public data and technical analysis. Trading involves substantial risk of loss. Past performance does not guarantee future results. Use your own judgment, conduct your own research, and never risk more than you can afford to lose. Always set stop-losses and adjust position sizes according to your risk tolerance. The class action lawsuit and broader Chinese tech volatility may invalidate this thesis at any time.

Disclaimer
The information and publications are not meant to be, and do not constitute, financial, investment, trading, or other types of advice or recommendations supplied or endorsed by TradingView. Read more in the Terms of Use.
Disclaimer
The information and publications are not meant to be, and do not constitute, financial, investment, trading, or other types of advice or recommendations supplied or endorsed by TradingView. Read more in the Terms of Use.