

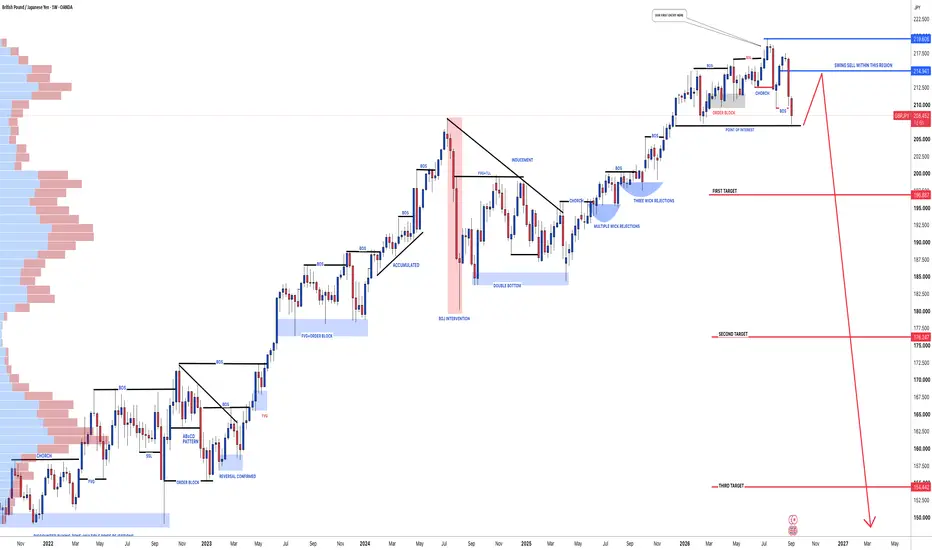
🔺GBPJPY’s long-term bullish run has reached a critical stage. After climbing into **219.606**, price swept liquidity above the previous highs but failed to maintain the breakout. The rejection was followed by a bearish **Change of Character (CHoCH)** and a confirmed **Break of Structure (BOS)**, providing the first serious evidence that buyers are losing control.
🔺At the time of the chart snapshot, GBPJPY is trading near **208.379**. Although the weekly outlook is bearish, selling immediately after the decline could provide an unfavourable entry. The cleaner opportunity may develop if price retraces into the marked premium region.
Main Swing-Sell Region
The chart highlights 214.941–219.606 as the key selling area.
🔺The lower boundary at 214.941 represents the first level where sellers could return, while 219.606 marks the liquidity-swept swing high. A retracement into this region would allow the market to form a lower high before potentially continuing downward.
Retail traders should watch for confirmation such as:
* A strong bearish rejection
* A lower high on the daily or four-hour timeframe
* A bearish engulfing candle
* A fresh downside structure break after the retest
🔺Entering solely because price reaches the zone is risky. The reaction from the area will reveal whether sellers genuinely remain in control.
Bearish Targets
🔺If GBPJPY rejects the sell region and continues breaking lower, the chart identifies three major objectives:
* **First target: 196.887**
* **Second target: 176.247**
* **Third target: 154.442**
🔺The first target is positioned near an important previous breakout and support area. It is the most realistic initial objective and could be used to secure partial profit.
🔺The second target at 176.247 represents a much deeper weekly correction into an earlier demand region. The final objective at 154.442 is a long-term projection near the base of the broader bullish cycle. These lower targets should be treated as separate stages rather than one uninterrupted move.
Confirmation and Invalidation
🔺A sustained weekly break below the current **207.000–208.000 support area** would strengthen the bearish scenario and create a clearer route toward 196.887.
🔺The bearish outlook would be invalidated by a decisive weekly close above **219.606**. Such a move would show that the liquidity sweep has failed to produce a lasting reversal and that the long-term bullish trend may be resuming.
Risk Management
🔺This is a weekly swing setup with a wide selling zone, so using a fixed lot size would be inappropriate. Position size should be calculated from the chosen entry, confirmation level and stop placement.
🔺Traders should also avoid chasing price near 208.379 after the initial decline. Waiting for either a confirmed retracement into 214.941–219.606 or a clean breakdown-and-retest of current support offers a more controlled approach.
Final Outlook
🔺GBPJPY is showing its strongest bearish warning in several years. The liquidity sweep at **219.606**, followed by CHoCH and BOS, suggests that the pair may be entering a larger corrective phase.
🔺A rejection from **214.941–219.606** would support a decline toward **196.887** initially. Continued weekly weakness could later expose **176.247** and **154.442**.
🔺The opportunity is not simply to sell because price has fallen—it is to wait for the market to confirm that the former buyers have become trapped beneath the highs.
LIKE AND COMMENT❤️
THE SETUPSFX_ TEAM🇬🇧❤️

Looking for intraday signals on Forex and XAUUSD (GOLD) with 98% Win Rate In Gold And 83% Win Rate In Forex!
Forex Bot: t.me/SetupsfxFOREX_Bot
Gold Bot: t.me/SetupsfxGOLD_Bot
Forex Bot: t.me/SetupsfxFOREX_Bot
Gold Bot: t.me/SetupsfxGOLD_Bot
Related publications
Disclaimer
The information and publications are not meant to be, and do not constitute, financial, investment, trading, or other types of advice or recommendations supplied or endorsed by TradingView. Read more in the Terms of Use.