
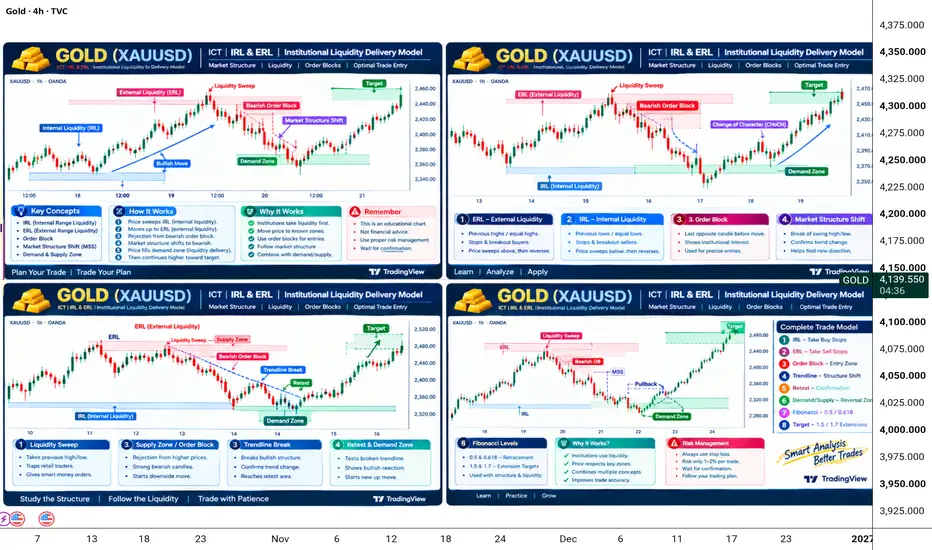
GOLD (XAUUSD) ICT IRL & ERL | Institutional Liquidity Delivery Model
This educational chart explains a structured ICT-inspired liquidity delivery model for Gold (XAUUSD), combining Internal Range Liquidity (IRL), External Range Liquidity (ERL), Liquidity Sweeps, Order Blocks, Market Structure Shift (MSS/CHoCH), Trendline Breaks, Fibonacci Retracement and Extension Targets.
The purpose of this chart is to understand why price moves from one liquidity area to another and how candle behavior can provide information about market structure.
This is an educational model, not a guaranteed prediction or live trading signal.
---
1. Initial Bullish Structure
The chart begins with price creating a sequence of higher highs and higher lows.
The bullish candles gradually push price upward while smaller bearish candles create temporary pullbacks.
Candle-by-candle logic:
- Early bullish candles: Buyers begin pushing price away from the lower range.
- Small bearish candles: Temporary profit-taking appears, but sellers cannot break the previous important low.
- Next bullish candles: Buyers return and price creates a new higher high.
- Pullback candles: Price retraces but maintains the bullish structure.
- Continuation candles: Another higher high confirms that buyers are still participating.
The important lesson is that trend direction is determined by the overall structure of highs and lows rather than by one individual candle.
---
2. Internal Range Liquidity — IRL
The IRL (Internal Range Liquidity) area represents liquidity located within the current trading range.
Previous internal highs and lows can become areas where price reacts before continuing toward larger external liquidity.
Candle reasoning:
When price approaches an internal liquidity area, candles can become smaller because buyers and sellers are temporarily balanced.
If price briefly moves through an internal high or low and then reverses, the reaction becomes more important than the initial breakout candle.
This is why the candles immediately after the sweep should be studied carefully.
---
3. External Range Liquidity — ERL
The ERL (External Range Liquidity) represents liquidity around important external swing highs or lows.
In the bearish example, price moves toward a previous high before reacting downward.
Candle-by-candle logic:
- Bullish candles: Price continues toward the previous external high.
- Final bullish candles: Momentum pushes price into the ERL area.
- Liquidity-sweep candle: Price trades above the previous high.
- Rejection candle: Price fails to maintain the breakout.
- Bearish candle: Sellers begin moving price away from the liquidity zone.
- Following bearish candles: Downward momentum becomes clearer.
The key educational point is that a liquidity sweep alone does not confirm a reversal. The candles that follow the sweep provide additional information.
---
4. Liquidity Sweep
The liquidity sweep is one of the central concepts in this model.
Price temporarily trades beyond a previous high or low and then reacts back into the range.
Why each candle matters:
The candle that reaches beyond the previous level shows the liquidity-taking movement.
The next candle is important because it shows whether price is being accepted above the level or rejected back into the range.
If several following candles continue moving away from the swept area, the reversal structure becomes more visible.
---
5. Bearish Order Block
After the liquidity sweep, the chart identifies a Bearish Order Block / Supply Zone.
This area is used as a potential location where selling pressure may appear.
Candle reasoning:
- The final bullish candles push price into the supply area.
- Momentum begins slowing.
- Rejection appears around the zone.
- Bearish candles then move away from the area.
- Consecutive bearish candles create lower highs and lower lows.
The order block should not be treated as automatically valid simply because price touches it. The reaction and subsequent market structure are important.
---
6. Market Structure Shift — MSS / CHoCH
After the liquidity sweep and order-block reaction, price begins breaking previous short-term swing structure.
This is marked as a Market Structure Shift / Change of Character.
Candle-by-candle logic:
- Price initially forms higher highs.
- Selling pressure begins creating lower highs.
- A bearish candle breaks an important previous swing low.
- Subsequent candles remain below that structure.
- Lower highs and lower lows begin developing.
This sequence provides evidence that the previous bullish structure is changing.
---
7. Trendline Break
The trendline represents the previous directional structure.
When price closes below the bullish trendline, the chart marks a Trendline Break.
Candle reasoning:
A wick through the trendline alone does not necessarily establish a structural break.
A stronger candle close beyond the trendline provides more information.
The candles following the break are then monitored to determine whether price accepts the new structure or returns above it.
---
8. Retest
Following the trendline break, price can return toward the broken structure.
This is the Retest phase.
Candle-by-candle logic:
- Initial bearish candles move away from the broken trendline.
- Smaller bullish candles begin a retracement.
- Price approaches the former support/trendline.
- Bullish momentum becomes weaker around the retest.
- A bearish reaction confirms that sellers are still active.
The retest is educationally important because it demonstrates how former support can potentially behave as resistance.
---
9. IRL to Demand Zone
As price continues lower, it approaches an important internal liquidity/support area.
The candles become increasingly important near the Demand Zone.
Candle reasoning:
- Strong bearish candles show continued selling pressure.
- Smaller candles indicate that momentum may be slowing.
- Long rejection wicks can show reaction from the lower zone.
- A bullish candle begins moving away from support.
- Subsequent bullish candles provide additional confirmation.
The reaction should always be considered in the context of the complete market structure.
---
10. Bullish Market Structure Shift
After the decline, price begins forming a new bullish structure from the demand area.
A bullish candle breaks a previous minor high, followed by additional higher highs and higher lows.
Candle reasoning:
- Initial bullish candle shows buyers reacting from demand.
- Small pullback candles test the new structure.
- Another bullish candle breaks the previous minor high.
- Follow-up candles create higher highs.
- Higher lows establish the developing bullish structure.
This creates the possibility of a transition from bearish movement to bullish continuation.
---
11. Fibonacci 0.5 & 0.618 Retracement
The 0.5 and 0.618 Fibonacci retracement levels are used as potential reaction areas.
These levels are not guaranteed reversal points.
Candle reasoning:
When price reaches the Fibonacci area, traders can study:
- candle size,
- rejection wicks,
- closing position,
- consecutive bullish or bearish candles,
- nearby liquidity,
- order-block location,
- and market structure.
A Fibonacci level becomes more informative when it aligns with other technical factors.
---
12. Fibonacci 1.5 & 1.7 Extensions
The 1.5 and 1.7 Fibonacci extension levels are shown as potential extended target areas.
These levels can be used to study where a continuation move may encounter another reaction.
Candle reasoning:
As price approaches an extension target:
- Strong candles indicate continued momentum.
- Smaller candles may show consolidation.
- Rejection candles can indicate profit-taking.
- A strong continuation close suggests momentum is still active.
Targets should therefore be treated as reference zones rather than guaranteed destinations.
---
Complete Candle-by-Candle Sequence
The complete educational logic of the chart can be summarized as:
1. Bullish candles → Higher highs begin forming.
2. Pullback candles → Higher low develops.
3. Continuation candles → Price moves toward external liquidity.
4. ERL approach candles → Price reaches the previous swing high.
5. Liquidity-sweep candle → Price moves beyond the previous high.
6. Rejection candle → Price fails to maintain the breakout.
7. Bearish candles → Selling pressure increases.
8. Order-block reaction → Price moves away from the supply area.
9. MSS/CHoCH candle → Previous short-term structure breaks.
10. Trendline-break candle → Bullish trendline loses support.
11. Retest candles → Price returns toward the broken structure.
12. Bearish rejection → Retest fails to regain the previous structure.
13. Continuation candles → Lower highs and lower lows develop.
14. Demand-zone reaction → Selling momentum begins slowing.
15. Bullish confirmation candle → Buyers begin reacting from demand.
16. Structure-break candle → Minor bearish structure is broken.
17. Higher-high candles → New bullish structure develops.
18. Pullback candles → Price retests the new bullish structure.
19. Continuation candles → Buyers push price toward the next target.
20. Fibonacci extension area → Price approaches the 1.5 / 1.7 target region.
---
Complete ICT-Style Educational Flow
IRL → ERL → Liquidity Sweep → Order Block → MSS/CHoCH → Trendline Break → Retest → Demand/Supply Reaction → Fibonacci 0.5/0.618 → Confirmation → Continuation → Fibonacci 1.5/1.7 Targets
The main lesson is that price action should be studied as a sequence of events rather than by looking at one candle in isolation.
Liquidity identifies areas of interest, market structure provides directional information, order blocks identify potential reaction zones, Fibonacci provides additional reference levels, and candle behavior helps evaluate confirmation.
---
Important Risk Reminder
No technical setup is guaranteed to work every time.
A liquidity sweep can fail, an order block can break, a trendline can be reclaimed, and Fibonacci levels can be ignored by the market.
Always define an invalidation level, manage position size appropriately, and wait for confirmation according to your own trading plan.
Educational Disclaimer
This chart is created for educational and technical-analysis purposes only. It is not financial advice, investment advice, or a guarantee of future price movement.
The levels shown in this educational model are illustrative and should not be treated as current live-market signals.
Study the Liquidity → Read the Candles → Confirm the Structure → Manage the Risk
Plan Your Trade | Trade Your Plan
Note
GOLD (XAUUSD) — ICT IRL & ERL Educational Note
This chart explains an ICT-inspired liquidity model using IRL, ERL, Liquidity Sweep, Order Block, MSS/CHoCH, Trendline, Retest and Fibonacci.
Market Structure
Higher Highs + Higher Lows = bullish structure.
Lower Highs + Lower Lows = bearish structure.
Candle Reason: Strong candles show directional pressure, while smaller candles often represent pullbacks or consolidation.
IRL & ERL
IRL: Liquidity inside the current range.
ERL: Liquidity around important external swing highs/lows.
Price can move from internal liquidity toward external liquidity.
Liquidity Sweep
Price temporarily moves above a previous high or below a previous low and then reacts back.
Candle Reason: The sweep candle takes the level; the following rejection candles show whether price is being accepted or rejected.
Order Block
The order-block area is studied around the price movement that precedes strong displacement.
Candle Reason: Rejection followed by strong displacement can provide evidence of a potential reaction zone.
MSS / CHoCH
When price breaks an important previous swing, market structure may shift.
Candle Reason: A decisive candle breaking structure is more meaningful when following candles continue in the new direction.
Trendline Break & Retest
A strong candle closes beyond the previous trendline, followed by a possible retest.
Candle Reason: Smaller retracement candles test the broken level; a rejection candle can confirm continuation.
Fibonacci 0.5 & 0.618
These levels are used as potential retracement areas.
Candle Reason: Watch for rejection, consolidation or continuation around these levels rather than assuming an automatic reversal.
Fibonacci 1.5 & 1.7
These are potential extension/target reference areas.
Candle Reason: Strong candles show continuation, while smaller candles or rejection may indicate a reaction near the target.
Complete Model
IRL → ERL → Liquidity Sweep → Order Block → MSS/CHoCH → Trendline Break → Retest → Fibonacci 0.5/0.618 → Confirmation → Continuation → 1.5/1.7 Targets
Key Lesson
Don't focus on one candle. Read the complete story of price.
Study the liquidity, structure, candle reaction, confirmation and risk before considering any setup.
Educational content only. Not financial advice. No setup guarantees future price movement.
Study → Confirm → Manage Risk

Join telegram channel free.
t.me/+vdrq1ao1LppiMmQ0
Forex, Gold & Crypto Signals with detailed analysis & get consistent results.
Gold Signal's with proper TP & SL for high profit opportunities
t.me/+vdrq1ao1LppiMmQ0
t.me/+vdrq1ao1LppiMmQ0
Forex, Gold & Crypto Signals with detailed analysis & get consistent results.
Gold Signal's with proper TP & SL for high profit opportunities
t.me/+vdrq1ao1LppiMmQ0
Disclaimer
The information and publications are not meant to be, and do not constitute, financial, investment, trading, or other types of advice or recommendations supplied or endorsed by TradingView. Read more in the Terms of Use.