
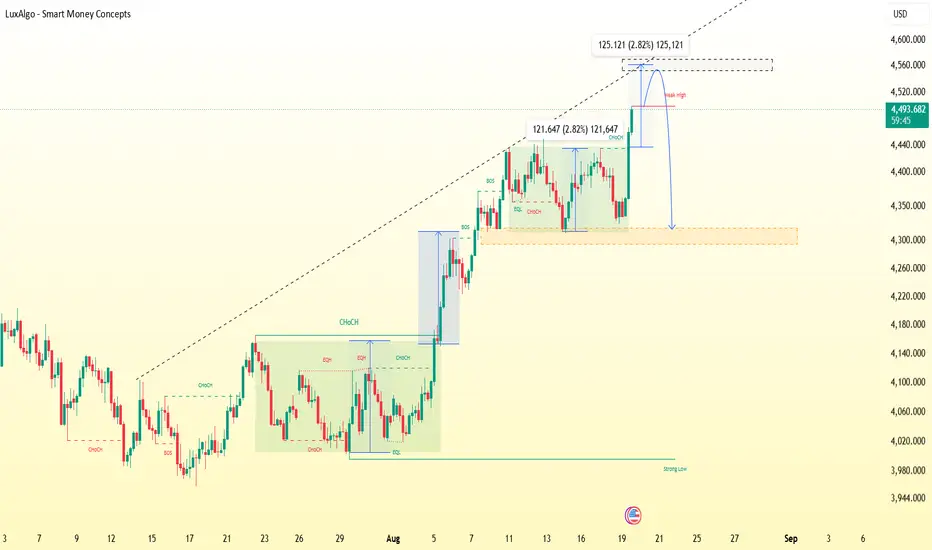
XAUUSD is showing a strong bullish market structure, supported by multiple Break of Structure confirmations and a clear sequence of higher highs and higher lows. The latest impulsive move has pushed price toward 4,494, confirming strong buying pressure and continuation above previous resistance.
STRONG BULLISH RANGE
4,490–4,500
Current price and immediate bullish decision zone. Holding above this range keeps buyers in control and supports continuation toward the higher resistance levels.
4,440–4,460
Strong structural resistance and previous Weak High area. A confirmed breakout and sustained hold above this range would strengthen the bullish continuation setup.
4,550–4,560
Major upside resistance and liquidity zone. This is the primary projected bullish target area shown on the chart. A clean breakout above 4,560 could open the way for further price discovery.
STRONG SUPPORT RANGES
4,300–4,320
Major demand and structural support zone. This is the key pullback area from the latest bullish expansion. Holding this range would preserve the broader bullish structure.
4,150–4,180
Important previous accumulation and breakout zone. This area can act as secondary support if deeper retracement develops.
3,990–4,020
Major Strong Low and long-term structural support. A decisive break below this region would significantly weaken the current bullish structure.
LONG BULLISH STRUCTURE
The higher-timeframe charts show accumulation followed by repeated CHoCH and BOS confirmations. Price then expanded from the 4,000 area toward 4,150, consolidated around 4,300–4,440, and recently broke higher toward 4,494.
As long as price maintains the higher-low structure and remains supported above the 4,300–4,320 zone, the broader bullish bias remains strong. The 4,440–4,460 range is the key confirmation area, while 4,550–4,560 remains the major upside liquidity and resistance zone.
This is a technical and educational market-structure analysis, not a guaranteed forecast or financial advice. Confirmation, invalidation levels, and proper risk management should always be considered.

XAUUSD is showing a strong bullish market structure, with multiple BOS confirmations and a clear sequence of higher highs and higher lows. Price has respected the major Strong Low near 3,991 and expanded upward from the accumulation range, confirming increasing buying pressure.
CURRENT PRICE RANGE
4,150–4,165
Current price is holding near this zone after a strong bullish expansion. Maintaining this area supports the continuation of the bullish structure.
STRONG SUPPORT RANGE
4,100–4,125
Important structural support and previous BOS area. A successful retest and bullish reaction from this zone would keep the long setup technically strong.
MAJOR DEMAND RANGE
3,990–4,020
Major Strong Low and long-term structural support. This remains the key invalidation region for the broader bullish structure.
IMMEDIATE UPSIDE RANGE
4,175–4,185
Current Weak High and liquidity area. A clean breakout above 4,180 with confirmation could signal another bullish expansion.
MAJOR LONG TARGET RANGE
4,300–4,315
The chart projects this as the major upside objective from the current structure, representing approximately 153 points of potential expansion from the marked range.

LONG BIAS
The overall structure remains bullish while price holds above the major support zones. The preferred educational scenario is a bullish continuation after confirmation above the Weak High, with 4,300–4,315 acting as the next major resistance and liquidity zone.
A sustained break below the major structural support would weaken the bullish thesis and require reassessment. This analysis is for educational purposes only and is not financial advice

XAUUSD is showing a strong bullish higher-timeframe structure despite the current pullback. Price has developed multiple CHoCH and BOS confirmations, while the major Strong Low around 4,310 remains intact. The current decline can be viewed as a retracement within the broader bullish structure unless the key support is decisively broken.
CURRENT PRICE
4,335–4,345
Current price is trading inside the lower portion of the recent range. This is an important reaction area because price is approaching the Strong Low support.
STRONG SUPPORT RANGE
4,310–4,325
Major structural support and Strong Low zone. A bullish reaction from this range would support the long continuation scenario. A decisive breakdown below this area would weaken the current bullish structure.
PRIMARY BULLISH RANGE
4,380–4,420
Important internal structure and previous BOS area. Reclaiming and holding above this range would provide stronger confirmation that buyers are regaining control.
STRONG RESISTANCE RANGE
4,435–4,455
Major previous high and Weak High liquidity zone. A confirmed breakout above 4,455 would strengthen the bullish continuation setup.
LONG TARGET RANGE
4,550–4,560
Major projected upside target and liquidity area shown on the chart. The measured move indicates approximately 125 points of potential expansion from the marked structure.
LONG STRUCTURE
The overall structure remains bullish while 4,310–4,325 holds. The preferred educational scenario is a reaction from the Strong Low, followed by recovery above 4,380–4,420 and a bullish breakout through 4,435–4,455. If confirmed, the next major upside area is 4,550–4,560.
If price decisively breaks below 4,310, the bullish structure should be reassessed rather than assuming continuation.
This analysis is based on the displayed chart structure and is for educational purposes only, not financial advice.
STRONG BULLISH RANGE
4,490–4,500
Current price and immediate bullish decision zone. Holding above this range keeps buyers in control and supports continuation toward the higher resistance levels.
4,440–4,460
Strong structural resistance and previous Weak High area. A confirmed breakout and sustained hold above this range would strengthen the bullish continuation setup.
4,550–4,560
Major upside resistance and liquidity zone. This is the primary projected bullish target area shown on the chart. A clean breakout above 4,560 could open the way for further price discovery.
STRONG SUPPORT RANGES
4,300–4,320
Major demand and structural support zone. This is the key pullback area from the latest bullish expansion. Holding this range would preserve the broader bullish structure.
4,150–4,180
Important previous accumulation and breakout zone. This area can act as secondary support if deeper retracement develops.
3,990–4,020
Major Strong Low and long-term structural support. A decisive break below this region would significantly weaken the current bullish structure.
LONG BULLISH STRUCTURE
The higher-timeframe charts show accumulation followed by repeated CHoCH and BOS confirmations. Price then expanded from the 4,000 area toward 4,150, consolidated around 4,300–4,440, and recently broke higher toward 4,494.
As long as price maintains the higher-low structure and remains supported above the 4,300–4,320 zone, the broader bullish bias remains strong. The 4,440–4,460 range is the key confirmation area, while 4,550–4,560 remains the major upside liquidity and resistance zone.
This is a technical and educational market-structure analysis, not a guaranteed forecast or financial advice. Confirmation, invalidation levels, and proper risk management should always be considered.
XAUUSD is showing a strong bullish market structure, with multiple BOS confirmations and a clear sequence of higher highs and higher lows. Price has respected the major Strong Low near 3,991 and expanded upward from the accumulation range, confirming increasing buying pressure.
CURRENT PRICE RANGE
4,150–4,165
Current price is holding near this zone after a strong bullish expansion. Maintaining this area supports the continuation of the bullish structure.
STRONG SUPPORT RANGE
4,100–4,125
Important structural support and previous BOS area. A successful retest and bullish reaction from this zone would keep the long setup technically strong.
MAJOR DEMAND RANGE
3,990–4,020
Major Strong Low and long-term structural support. This remains the key invalidation region for the broader bullish structure.
IMMEDIATE UPSIDE RANGE
4,175–4,185
Current Weak High and liquidity area. A clean breakout above 4,180 with confirmation could signal another bullish expansion.
MAJOR LONG TARGET RANGE
4,300–4,315
The chart projects this as the major upside objective from the current structure, representing approximately 153 points of potential expansion from the marked range.
LONG BIAS
The overall structure remains bullish while price holds above the major support zones. The preferred educational scenario is a bullish continuation after confirmation above the Weak High, with 4,300–4,315 acting as the next major resistance and liquidity zone.
A sustained break below the major structural support would weaken the bullish thesis and require reassessment. This analysis is for educational purposes only and is not financial advice
XAUUSD is showing a strong bullish higher-timeframe structure despite the current pullback. Price has developed multiple CHoCH and BOS confirmations, while the major Strong Low around 4,310 remains intact. The current decline can be viewed as a retracement within the broader bullish structure unless the key support is decisively broken.
CURRENT PRICE
4,335–4,345
Current price is trading inside the lower portion of the recent range. This is an important reaction area because price is approaching the Strong Low support.
STRONG SUPPORT RANGE
4,310–4,325
Major structural support and Strong Low zone. A bullish reaction from this range would support the long continuation scenario. A decisive breakdown below this area would weaken the current bullish structure.
PRIMARY BULLISH RANGE
4,380–4,420
Important internal structure and previous BOS area. Reclaiming and holding above this range would provide stronger confirmation that buyers are regaining control.
STRONG RESISTANCE RANGE
4,435–4,455
Major previous high and Weak High liquidity zone. A confirmed breakout above 4,455 would strengthen the bullish continuation setup.
LONG TARGET RANGE
4,550–4,560
Major projected upside target and liquidity area shown on the chart. The measured move indicates approximately 125 points of potential expansion from the marked structure.
LONG STRUCTURE
The overall structure remains bullish while 4,310–4,325 holds. The preferred educational scenario is a reaction from the Strong Low, followed by recovery above 4,380–4,420 and a bullish breakout through 4,435–4,455. If confirmed, the next major upside area is 4,550–4,560.
If price decisively breaks below 4,310, the bullish structure should be reassessed rather than assuming continuation.
This analysis is based on the displayed chart structure and is for educational purposes only, not financial advice.
Note
XAUUSD — Bullish Market StructureXAUUSD continues to maintain a bullish structure, with higher highs and higher lows supporting the current upside momentum. Price action remains constructive while holding above key structural zones.
Key Levels:
4,490–4,500 — Immediate bullish decision zone
4,440–4,460 — Key resistance / breakout area
4,550–4,560 — Major upside resistance and liquidity zone
A sustained hold above the key bullish zone would keep the continuation structure intact. A clean breakout and confirmation above major resistance could support further upside momentum.
Note
XAUUSD | Bullish StructurePrice continues to respect a clear bullish market structure, with consistent Higher Highs (HH) and Higher Lows (HL). Strong buying momentum remains visible as price holds above key structural zones.
Structure remains bullish while key support holds. A confirmed breakout above major resistance could signal further continuation, while rejection or a structure break may indicate a potential shift in momentum.

What You'll Get
Technical & fundamental analysis
Risk management tips to protect your capital
t.me/+MZQEnS08gLdlNjg8
JOIN MY TELEGRAM DAILY FREE SIGNAL
t.me/+_r_j8vfYwy03ODVk
Technical & fundamental analysis
Risk management tips to protect your capital
t.me/+MZQEnS08gLdlNjg8
JOIN MY TELEGRAM DAILY FREE SIGNAL
t.me/+_r_j8vfYwy03ODVk
Disclaimer
The information and publications are not meant to be, and do not constitute, financial, investment, trading, or other types of advice or recommendations supplied or endorsed by TradingView. Read more in the Terms of Use.