
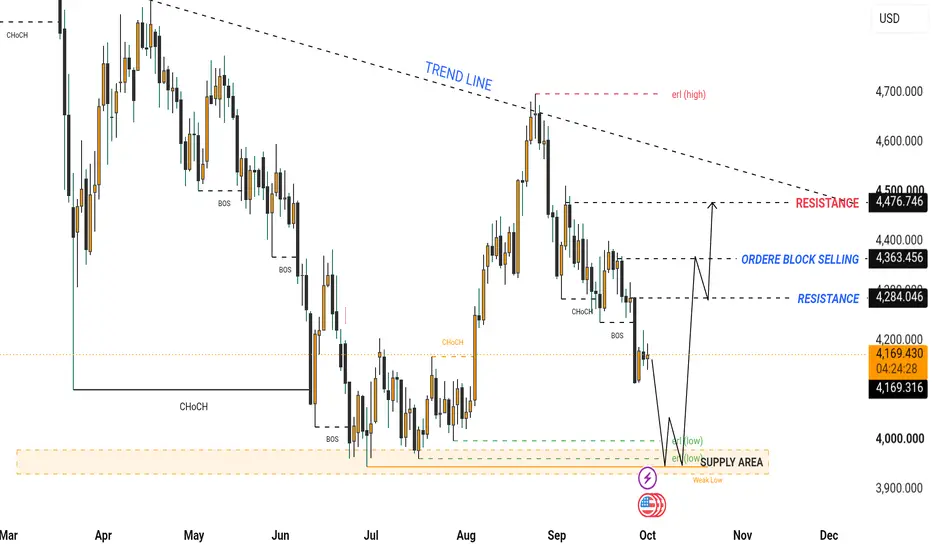
The chart represents a market that has transitioned from a strong bullish advance into a clear corrective/bearish structure. The most important feature is the sequence of lower highs and lower lows developing beneath the descending trend line.
At the moment, price is around 4,176, sitting below the marked 4,284 resistance and above the major 3,900–4,000 liquidity/supply zone.
1. Higher-timeframe structure
Starting from the left side of the chart, price initially moved strongly upward and eventually reached the 4,800+ region.
After that major high, the market failed to maintain the bullish structure.
Price began producing:
High → lower high → lower low → lower high → lower low
This is important because it indicates that sellers gradually gained control after the major high.
The descending dashed trend line reinforces this structure. Several important swing highs are positioned beneath or around this trend line, making it a visual representation of the broader bearish pressure.
The trend line currently sits roughly around the 4,500–4,600 region, depending on where it is intersected.
2. The major bearish transition
One of the most important parts of the chart is the sequence of BOS (Break of Structure) markings.
Earlier in the chart, there are multiple bearish BOS events.
A BOS to the downside means that price has broken an important previous swing low, indicating that the existing market structure has been violated.
The repeated downside BOS signals show that this isn't simply one isolated rejection. The chart is showing a progressive deterioration of market structure.
This is why the overall structure shown on the chart remains bearish until price can reclaim important structural levels.
3. CHoCH areas
There are also several CHoCH (Change of Character) markings.
A CHoCH generally represents an early indication that the current directional structure may be changing.
The important thing is that a CHoCH is not automatically a full trend reversal.
For example, if price is bearish and produces a bullish CHoCH, we would normally want to see:
CHoCH → displacement → higher high → successful retest → continuation
before treating the change as a stronger bullish structural shift.
The chart therefore appears to be identifying areas where the market temporarily changed character, but the larger structure subsequently remained vulnerable to selling.
4. Current price: ~4,176
The current displayed price is approximately:
4,175.96
This is a critical location because price has already moved below the marked 4,284 resistance.
That means the market is currently trading beneath an important structural reference.
The immediate question from a technical-analysis perspective is:
Will 4,284 remain resistance, or will price reclaim it?
A sustained reclaim of 4,284 would improve the short-term structure.
Failure to reclaim it keeps the bearish structure intact and leaves the lower liquidity area vulnerable.
5. First major resistance — 4,284
The first important resistance marked on the chart is approximately:
4,284
This level is important because it represents a previous structural area and is explicitly marked RESISTANCE.
If price rallies from the current area, 4,284 is the first major level to monitor.
Bearish reaction
If price reaches 4,284 and rejects strongly, that would indicate sellers are still defending the broken structure.
The sequence could then be:
4,176 → 4,284 → rejection → lower low
Bullish reclaim
If price instead breaks above 4,284 with strong momentum and subsequently holds it as support, the next upside level becomes much more relevant.
6. Order Block Selling — ~4,363
The next important area is approximately:
4,363
The chart specifically labels this:
ORDER BLOCK SELLING
This suggests that the chart author considers this area a potential institutional/seller reaction zone.
The important distinction is that an order block should not be treated as an automatic reversal point.
What matters is how price behaves when it enters the zone.
For example:
Price enters 4,363 → rejection → bearish displacement
would strengthen the idea of active sellers.
Whereas:
Price enters 4,363 → consolidates → breaks above → retests successfully
would weaken the bearish interpretation.
Therefore, 4,363 is a reaction zone rather than a guaranteed reversal level.
7. Major resistance — ~4,477
The strongest clearly marked resistance on the chart is approximately:
4,476.746
This is particularly important because it sits close to the descending trend line.
So around 4,477, two technical factors overlap:
Horizontal resistance + descending trend-line resistance
That creates a potentially significant confluence zone.
If price reaches this area, the market would need to demonstrate considerable strength to establish a convincing bullish structural recovery.
A rejection there would preserve the larger bearish structure.
A sustained breakout and acceptance above it would materially change the structure shown on this chart.
8. Descending trend line
The dashed trend line begins near the previous major high and slopes downward toward the right.
This is essentially defining the bearish channel/pressure structure.
The market has repeatedly failed to establish sustained strength above this descending line.
Therefore, the trend line acts as dynamic resistance.
The important area is not simply the line itself.
The more significant zone is the combination of:
Trend line + ~4,477 resistance + previous swing structure
A convincing break above this entire area would be much more meaningful than a temporary wick through the line.
9. Lower liquidity zone — 3,900–4,000
Now we come to the most important downside area on the chart.
Near the bottom, the chart marks an area around:
3,900–4,000
with labels including:
SUPPLY AREA
ERL
Weak Low
4,000
liquidity/low markings
This area represents the collection of previous lows.
When multiple lows form around a similar price, traders often consider the area a potential liquidity pool because stop orders can accumulate around those lows.
The chart appears to anticipate that price could move toward this area before producing a meaningful reaction.
10. Weak Low
The Weak Low marking is especially important.
A weak low generally means that the low has not demonstrated strong rejection or structural protection and may therefore remain vulnerable to being taken.
In simple terms:
Weak low = liquidity may remain below it.
If price moves below the previous low, takes liquidity, and then rapidly recovers, that could be interpreted as a liquidity sweep.
However, simply breaking the low does not automatically mean a reversal.
We would want to see what happens after the liquidity is taken.
11. ERL / External Range Liquidity
The chart also marks ERL around the lower region.
External range liquidity generally refers to liquidity located outside a defined trading range.
The important idea is:
Previous low → liquidity underneath → price potentially moves into it → reaction may occur afterward.
This is why the chart's projected path first points downward toward the lower zone.
12. The projected path
The black arrows on the right side of the chart show the author's anticipated scenario.
The basic idea appears to be:
Current price ~4,176
↓
Move lower
↓
Test/sweep the ~3,900–4,000 liquidity area
↓
Potential bullish reaction
↓
Move toward 4,284
↓
Move toward 4,363 order-block selling zone
↓
Potential test of 4,477 major resistance
This is a scenario, not a confirmed future movement.
The market must actually provide confirmation at each stage.
13. What would confirm the bullish reversal idea?
If price reaches the lower 3,900–4,000 area, I would not consider the mere touch of that zone sufficient confirmation.
A stronger reversal sequence would look something like:
Liquidity sweep
→
strong bullish displacement
→
bullish CHoCH
→
higher high
→
retest
→
continuation
That would provide substantially more structural evidence of a reversal than simply seeing a bounce.
14. What would invalidate the bullish scenario?
The bullish recovery scenario becomes weaker if price continues falling through the lower liquidity zone without meaningful rejection.
In particular, if price breaks below the important lows and accepts below them, rather than quickly reclaiming them, the expected liquidity-sweep/reversal interpretation becomes less convincing.
In that situation, the lower zone would no longer be acting as effective support in the way the drawing anticipates.
15. What would confirm stronger bullish structure?
From the current position, the important sequence on the upside is:
4,284
then
4,363
then
4,477
But these levels should not be treated simply as a checklist.
The quality of the breakout matters.
For example:
Weak breakout
Price briefly moves above 4,284, leaves a wick, then falls back below it.
That would be a failed breakout/rejection.
Strong breakout
Price breaks 4,284 with displacement, closes above it, holds the level on a retest, and continues higher.
That would provide much stronger evidence of a structural recovery.
The same principle applies to 4,363 and 4,477.
16. Important distinction: short-term vs higher-timeframe
This is probably the most important professional point.
A bullish bounce from 3,900–4,000 does not automatically mean the entire bearish trend has reversed.
It could simply be a corrective rally inside the larger downtrend.
For the broader bearish structure shown on the chart to weaken substantially, price would need to reclaim progressively higher structural levels and eventually challenge/break the descending trend-line structure.
So there are potentially two different situations:
Bullish reaction:
3,900–4,000 → 4,284 → 4,363
versus
Larger bullish structural reversal:
4,477 area reclaimed → trend-line break → higher high/continuation.
Those are not the same thing.
17. The chart's overall story
Putting everything together:
The market made a major high around the 4,800+ region and subsequently entered a bearish structural phase.
Multiple downside BOS events confirmed continued weakness.
The descending trend line shows the broader bearish pressure.
Price then rallied strongly during August but failed around 4,600–4,700, close to the descending trend line.
After that rejection, price started falling again.
The market is now around 4,176, below the 4,284 resistance.
The chart therefore identifies two important opposing zones:
Above price
4,284 → 4,363 → 4,477
These are the major recovery/resistance areas.
Below price
3,900–4,000
This is the major liquidity/low zone shown on the chart.
Professional summary
The chart currently presents a bearish higher-structure with a potential liquidity-driven bullish reaction scenario.
The most important downside area is 3,900–4,000, where the chart identifies the weak low/external liquidity and supply zone.
The immediate structural resistance is 4,284.
Above that is the 4,363 selling order block, followed by the major 4,477 resistance, which also aligns closely with the descending trend line.
Therefore, the key structural sequence is:
4,176 current price
→ 3,900–4,000 liquidity zone if weakness continues
→ potential reaction/CHoCH
→ 4,284
→ 4,363
→ 4,477 + descending trend line
The critical point is that the reaction at 3,900–4,000 and the behavior around 4,284 are what would provide confirmation. The arrows on the chart represent a hypothesis, not a guaranteed price path.
If you're using this for actual trading, the cleanest approach is to wait for price action confirmation at these marked zones rather than entering solely because price reaches a level.
Trade active

Related publications
Disclaimer
The information and publications are not meant to be, and do not constitute, financial, investment, trading, or other types of advice or recommendations supplied or endorsed by TradingView. Read more in the Terms of Use.
Related publications
Disclaimer
The information and publications are not meant to be, and do not constitute, financial, investment, trading, or other types of advice or recommendations supplied or endorsed by TradingView. Read more in the Terms of Use.