
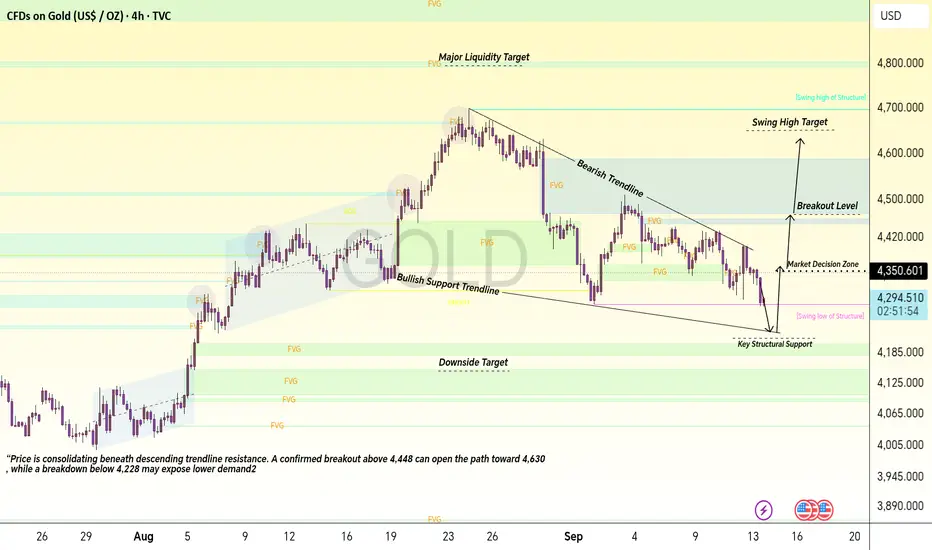
This chart explains Gold price action through market structure, FVGs, liquidity, trendlines, support/resistance, and candle behavior. Each candle provides information about the balance between buyers and sellers, while groups of candles reveal the larger market intention.
1. Initial Accumulation — Buyer Preparation
At the beginning of the chart, price moves sideways with relatively small candles. These candles show indecision and accumulation, as neither buyers nor sellers have complete control.
Repeated lower wicks show that sellers are attempting to push price lower, but buyers are absorbing the selling pressure. The reason for the later bullish move is visible here: price repeatedly holds the lower area instead of breaking down.
2. Bullish Expansion — Strong Buyer Control
Once buyers gain control, consecutive bullish candles begin forming higher highs and higher lows. The larger bullish candle bodies indicate strong buying momentum.
The rapid upward movement creates displacement and leaves several Fair Value Gaps (FVGs) behind. These gaps represent areas where price moved quickly and may later return for rebalancing.
3. Break of Structure — Trend Confirmation
As price breaks above previous swing highs, the candles confirm a Bullish Break of Structure (BOS).
The reason behind this move is the successful removal of previous resistance and increased demand. Pullback candles remain relatively controlled, showing that sellers are unable to create a meaningful reversal.
4. Strong Rally Toward the Swing High
The next sequence contains multiple bullish candles with higher closes. Each successful close above the previous candle's high confirms continued buyer strength.
Small bearish candles during this rally represent temporary profit-taking rather than immediate reversal because buyers continue to defend the previous structure.
5. Swing High Formation — Selling Pressure Appears
Near the major swing high, bullish candles become smaller and upper wicks become more visible. This behavior indicates that buying momentum is weakening.
The rejection from the upper area suggests that sellers are becoming active around premium pricing. This is the first important warning that the bullish expansion may enter a correction.
6. Bearish Reversal — Change in Momentum
After the swing high, stronger bearish candles appear. These candles push price below previous short-term support levels.
The reason for the decline is a shift in order flow: sellers begin producing lower highs and lower lows. The descending trendline then acts as dynamic resistance and reinforces the bearish structure.
7. Corrective Decline — Lower Highs and Lower Lows
During the downward phase, candles repeatedly fail near the descending trendline. Upper-wick rejections show sellers defending that area.
Each lower high provides confirmation that the correction is still active. Bearish displacement also creates additional imbalance/FVG areas that can become reaction zones.
8. Demand Reaction — Buyers Defend Support
When price approaches the lower structural area, bearish candles begin losing momentum. Long lower wicks show rejection from the downside.
This reaction indicates that buyers are defending the 4,228 area, which is marked as the swing low of structure. The candles here are important because a strong break below this level would change the structure significantly.
9. Current Consolidation — Market Decision Zone
The latest candles are moving inside a relatively narrow range beneath the descending trendline. This represents a decision area between buyers attempting recovery and sellers defending resistance.
The current price around 4,293 is positioned between the key support at 4,228 and resistance around 4,359–4,448.
10. Bullish Scenario
If bullish candles break and close above the descending trendline and then reclaim 4,359, the structure can strengthen toward 4,448.
A confirmed breakout above 4,448 would increase the probability of a move toward 4,630, followed by the higher liquidity area around 4,799.
11. Bearish Scenario
If price continues producing rejection candles from the descending trendline and breaks below 4,228, sellers may regain control.
A confirmed breakdown can expose the next structural area around 4,156, where the lower FVG/demand zones may provide another reaction.
Educational Takeaway
The important lesson from these candles is that one candle should not be analyzed in isolation. The reason behind a candle becomes clearer when it is combined with:
Candle body & wick → buying/selling pressure
BOS → structure confirmation
FVG → price imbalance
Trendline → dynamic resistance/support
Swing high → liquidity and rejection area
Swing low → structural protection
4,448 → key breakout confirmation
4,228 → key structural support
4,156 → lower demand/target area
This is an educational market-structure study, showing how candle behavior, liquidity and FVGs can be combined to understand Gold price action rather than relying on a single indicator or candle.
Trade active
Trade Update 📊🔴 Sell Trade: Active from 4300 → touched 3260 — 400+ pips running profit.
🟢 Buy Trade: Active from 4260 — 250 pips running profit
Both trades are active — stay disciplined and follow the plan toward the last target.
Note
Buy trade active from 4260 and market Touch 4310 500+ Running profit keep strong hold wait for my last target
Set sl to entry Point
Trade closed manually
🔴 Sell Trade: Active from 4300 → touched 3260 — 400+ pips running profit.🟢 Buy Trade: Active from 4260 → touched 4350 — 900+ pips running profit.
✅ Total: 1400+ Pips Done
🔒 50% Trades Manually Closed — Profit Secured
🎯 Remaining 50% Holding Until the Last Target
Keep strong, stay patient, and wait for the final target. Follow the rules.
Note
🟢 BUY Trade Update🟢 Buy Trade: 1100+ Pips Running Profit ✅
💰 Profit Secured: Strong move achieved
🎯 Last Target: Remaining position hold
🔒 50% Close — 50% Hold
💪 Keep Strong Hold & Wait for My Last Target.
📌 Follow the Rules & Stay Patient.

MY FREE SIGNALS CHANNEL 5 to 7 daily signals
t.me/+cHMXgrH3BMY1ODk0
✅ PERSONAL TELEGRAM
✅ Forex Vip Signals Premium Group 5 to 6 daily signals
t.me/+s-7xIereydUyMjhk
t.me/+cHMXgrH3BMY1ODk0
✅ PERSONAL TELEGRAM
✅ Forex Vip Signals Premium Group 5 to 6 daily signals
t.me/+s-7xIereydUyMjhk
Related publications
Disclaimer
The information and publications are not meant to be, and do not constitute, financial, investment, trading, or other types of advice or recommendations supplied or endorsed by TradingView. Read more in the Terms of Use.