
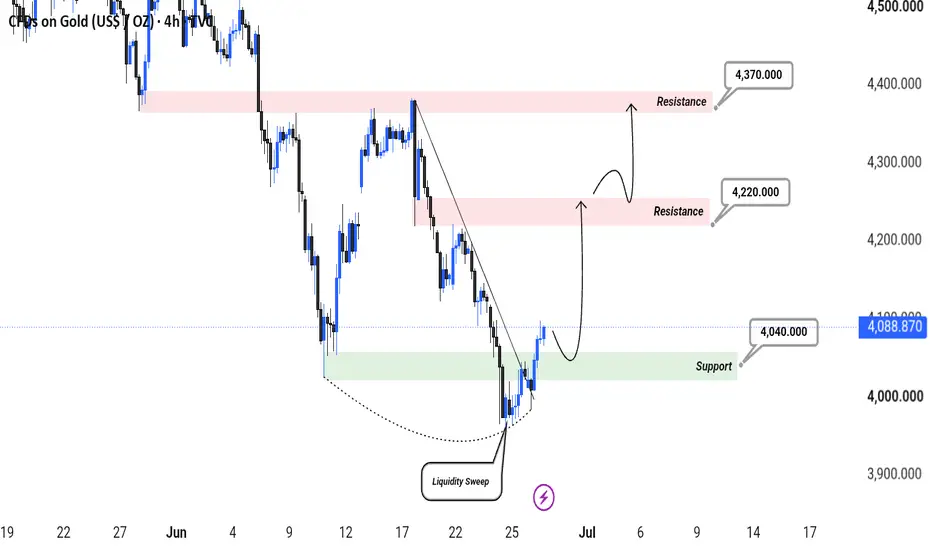
The Gold Price has been in a corrective downtrend on the 4 hour Time Frame throughout mid to late June. However, a significant structural shift occurred recently. The Gold plunged below the previous swing low to grab sell side liquidity before aggressively reversing upward, invalidating the bearish momentum and hinting at a transition from a bearish structure to a bullish recovery phase.
Key Confluences
Liquidity Sweep: The Gold Price dipped sharply below the Support zone, hitting a bottom near the 3,950 level. This effectively cleaned out liquidity sweep before instantly rejecting higher, which is a classic institutional accumulation sign.
Trendline Breakout: The steep trendline that tightly capped price action throughout the recent leg down has been breached to the upside with solid bullish candles.
Market Structure Shift: The aggressive expansion back above the 4,040 level confirms that buyers have taken back control, shifting the short term market structure from lower lows to a potential higher low setup.
Support and Resistance Zones
Support Zone: Buyers are firmly sitting in the support band around 4,040. Any corrective retests into this area are expected to be defended by bulls.
Resistance Zones: Sellers are currently clustered at two major overhead structural targets: the immediate resistance at 4,220. and a higher timeframe resistance zone at 4,370.
Projected Path
The projected path anticipates a minor pullback to test the newly 4,040. support zone as a validation. Following a successful retest, the price is expected to drive upward toward the first liquidity target at the 4,220 resistance level. A breakout above this area opens the door for a secondary leg extending toward the major and structural level at 4,370.
⚠️ Disclaimer: This is only for educational purposes. I'm not you Financial advisor.

Disclaimer
The information and publications are not meant to be, and do not constitute, financial, investment, trading, or other types of advice or recommendations supplied or endorsed by TradingView. Read more in the Terms of Use.
Disclaimer
The information and publications are not meant to be, and do not constitute, financial, investment, trading, or other types of advice or recommendations supplied or endorsed by TradingView. Read more in the Terms of Use.