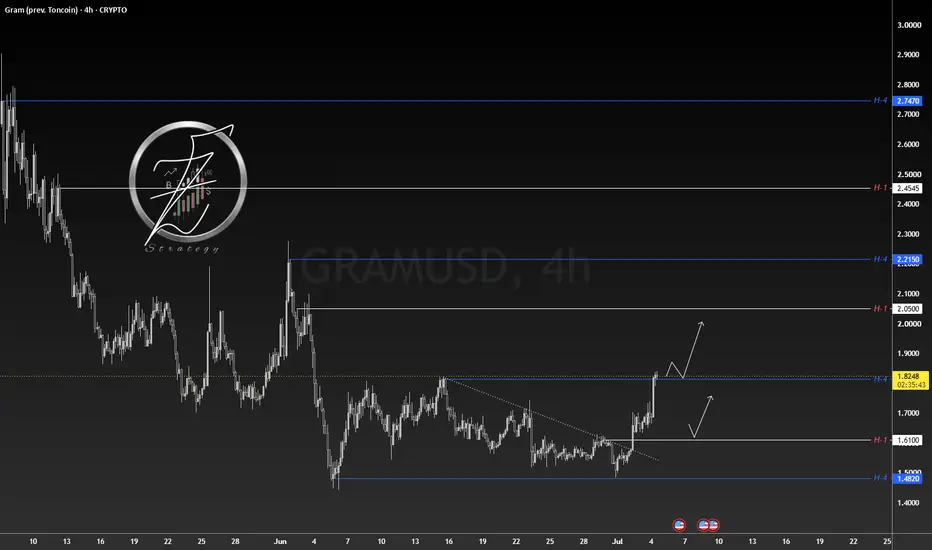
GRAMUSDT Analysis | 4H Chart | July 04, 2026
Follow price
 GRAMUSDT
❇️ Analysis Description: The bearish trendline has been broken on the 4H chart. We are currently testing the ceiling of the latest trading range at $1.8140. We are not in an absolute uptrend yet; a strong breakout above this level is required to confirm momentum. Otherwise, a pullback to the $1.6100 support level is a high-probability scenario for potential long entries.
🔼 Trading Setup Strategy:
🕯 Execution Plan (M15 Confirmation):
Follow price
GRAMUSDT❇️ Analysis Description: The bearish trendline has been broken on the 4H chart. We are currently testing the ceiling of the latest trading range at $1.8140. We are not in an absolute uptrend yet; a strong breakout above this level is required to confirm momentum. Otherwise, a pullback to the $1.6100 support level is a high-probability scenario for potential long entries.
🔼 Trading Setup Strategy:
- Trend Strategy: Identifying the "Pullback Candle" (breaking previous structure with >80% body coverage). Waiting for a retest of the candle's low/high line.
- Range Strategy: Applying the same "Pullback Candle" logic at range extremes, targeting a Risk/Reward of 1.5–2.0.
- Breakout Strategy: Currently monitoring the $1.8140 resistance. If broken, awaiting a pullback to the dynamic/static level before M15 entry.
🕯 Execution Plan (M15 Confirmation):
- Identify the "Pullback Candle" (80% body breakout).
- Enter on the retest of the breakout level.
- Stop Loss: Behind the last swing (preferred) or behind the entry candle if the body/shadow is large.
- Take Profit: Next major levels or fixed 2.5 R:R (for trends).
- ⚠️ Always prioritize risk management.
- 💬 Let me know your thoughts in the comments!

Related publications
Disclaimer
The information and publications are not meant to be, and do not constitute, financial, investment, trading, or other types of advice or recommendations supplied or endorsed by TradingView. Read more in the Terms of Use.
Related publications
Disclaimer
The information and publications are not meant to be, and do not constitute, financial, investment, trading, or other types of advice or recommendations supplied or endorsed by TradingView. Read more in the Terms of Use.