A great "Penny" stockYou will be thanking yourself for owning this company. Will beat the SPY very very easily and will produce more returns than you can imagine.
Thank me after a year
−0.55USD
10.06 MUSD
66.09 MUSD
6.80 M
About Gulf Resources, Inc.
Sector
CEO
Xiao Bin Liu
Headquarters
Shouguang
Website
Employees (FY)
435
Founded
1989
ISIN
US40251W4087
FIGI
BBG000CV85K5
Gulf Resources, Inc. is a holding company that engages in the manufacture of chemical products. It operates through the following segments: Bromine, Crude Salt, Chemical Products, and Natural Gas. It produces and trades bromine, crude salt and natural gas, and manufactures and sells chemical products used in oil and gas field exploration, oil and gas distribution, and oil field drilling. The firm also supplies papermaking chemical agents, inorganic chemicals, and manufactures materials for human and animal antibiotics. The company was founded by Ming Yang on February 28, 1989 and is headquartered in Shouguang, China.

$GURE, a bizarrely cheap Net Net stock.Last quarterly report puts NASDAQ:GURE well within Net Net stock territory.
Accordingly to the latest report, NASDAQ:GURE has $115.3M in cash and $18.1M in liabilities. Per share, intrinsic cash value is $9.34 per share vs today's price of $2.06.
Even before factoring in current assets this

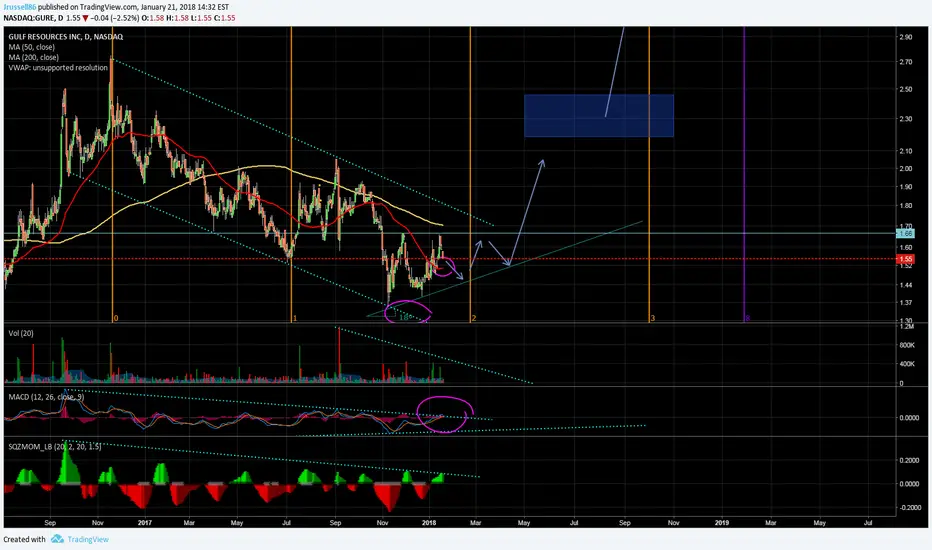
GURE good buy opportunity TP 1.6 maybe 2.0moving in siedways channel, multi bottom looks like a good chance to buy
future cash flow value 19.70


Head and Shoulders on hourlyGURE, *MAY provide better entry IF closes it least 3% below neck line. Minor Wave correction. Still long overall.
Very undervalued buying opportunity near.

Ascending triangle forming Within *8 year Symmetrical triangle.
50Dma now tilted up. *>50% Undervalued.
DCF Models put fair value @ 7.06-19.88
D/E&DA <.01; *Current Ratio≈36*
Ascending triangle forming since November brings opportunities to accumulate at safer prices. This daily formed after bouncing off bottom downtrend b
Loong Symmetrical triangle close to lower boundary line may provide excellent buying opportunity.
DCF FV=$7.06, 78% safety margin. Earnings put value 750% above current SP. Steady Annual & Qtly Net Income increase and NO DEBT!

200 Day Moving Average Break on 5 yearWith a break of the $2.03 price point we could see an aggressive move upwards in this stock. The weekly candles are showing up above the 200-day moving average and the 40/50-day moving averages are beginning to point upwards. Look for entry now with a stop placement around $1.35.

See all ideas
Trade directly on the supercharts through our supported, fully-verified and user-reviewed brokers.


Frequently Asked Questions
The current price of GURE is 1.37 USD — it has decreased by 1.08% in the past 24 hours.
Depending on the exchange, the stock ticker may vary. For instance, on NASDAQ exchange Gulf Resources, Inc. stocks are traded under the ticker GURE.
Gulf Resources, Inc. is going to release the next earnings report on May 13, 2024. Keep track of upcoming events with our Earnings Calendar.
GURE stock is 4.04% volatile and has beta coefficient of 0.24. Check out the list of the most volatile stocks — is Gulf Resources, Inc. there?
Yes, you can track Gulf Resources, Inc. financials in yearly and quarterly reports right on TradingView.
GURE stock has fallen by 0.72% compared to the previous week, the month change is a 13.22% rise, over the last year Gulf Resources, Inc. has showed a 48.59% decrease.
GURE net income for the last quarter is −1.78 M USD, while the quarter before that showed −681.82 K USD of net income which accounts for −160.45% change. Track more Gulf Resources, Inc. financial stats to get the full picture.
Today Gulf Resources, Inc. has the market capitalization of 14.45 M, it has decreased by 3.50% over the last week.
No, GURE doesn't pay any dividends to its shareholders. But don't worry, we've prepared a list of high-dividend stocks for you.
Like other stocks, GURE shares are traded on stock exchanges, e.g. Nasdaq, Nyse, Euronext, and the easiest way to buy them is through an online stock broker. To do this, you need to open an account and follow a broker's procedures, then start trading. You can trade Gulf Resources, Inc. stock right from TradingView charts — choose your broker and connect to your account.
As of Apr 19, 2024, the company has 435.00 employees. See our rating of the largest employees — is Gulf Resources, Inc. on this list?
Investing in stocks requires a comprehensive research: you should carefully study all the available data, e.g. company's financials, related news, and its technical analysis. So Gulf Resources, Inc. technincal analysis shows the sell today, and its 1 week rating is sell. Since market conditions are prone to changes, it's worth looking a bit further into the future — according to the 1 month rating Gulf Resources, Inc. stock shows the sell signal. See more of Gulf Resources, Inc. technicals for a more comprehensive analysis.
If you're still not sure, try looking for inspiration in our curated watchlists.
If you're still not sure, try looking for inspiration in our curated watchlists.
EBITDA measures a company's operating performance, its growth signifies an improvement in the efficiency of a company. Gulf Resources, Inc. EBITDA is 22.19 M USD, and current EBITDA margin is 65.97%. See more stats in Gulf Resources, Inc. financial statements.