
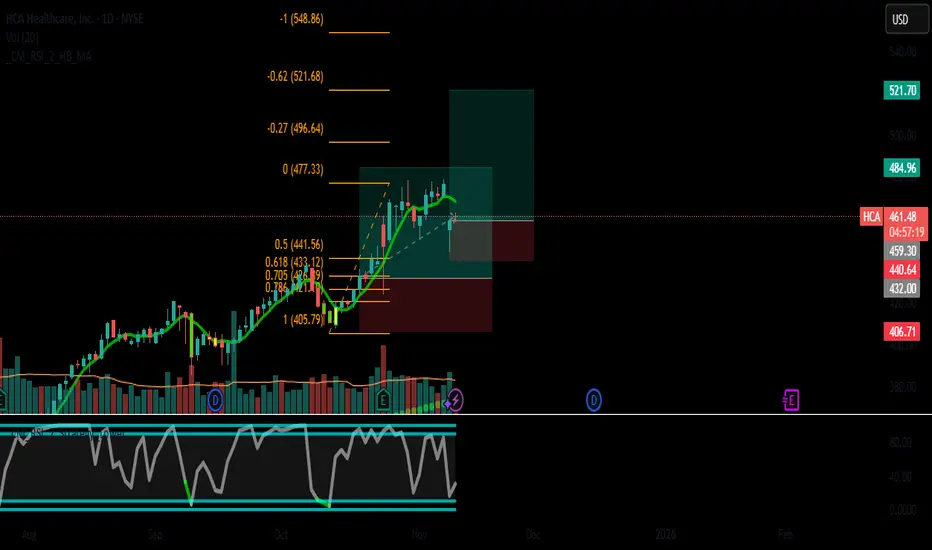
🎯 Ticker: HCA (NYSE)
📈 Type: Swing Long
⏰ Timeframe: Daily (D1) & 4H
📊 Multi-Timeframe Technical Analysis:
Daily Trend: BULLISH ✅
Technical Alignment: BUY Signals Across All Timeframes (Daily, 4H, 1H)
Key Support: $450-455 zone (Confluence of SMA 20 & previous resistance)
Momentum: RSI (57.6) shows healthy momentum with room to run
💡 Trading Thesis:
HCA presents a high-quality technical setup supported by strong fundamentals:
PERFECT TECHNICAL ALIGNMENT:
Rare "Triple Buy" signal across daily, 4H, and 1H timeframes
Trading above all key moving averages in clear uptrend
Recent breakout above $455 resistance now acting as support
SOLID FUNDAMENTAL BACKDROP:
Moderate Growth Profile: Steady revenue and earnings growth
Attractive Valuation: Fair P/E (17.7) and P/S (1.4) ratios
Sector Strength: Healthcare services showing resilience
INSTITUTIONAL SUPPORT:
Strong volume on up days confirms institutional accumulation
Healthcare sector benefiting from demographic tailwinds
⚡ Precision Trading Plan:
🎯 Entry: $462.87 (Optimal risk-reward entry zone)
🛑 Stop Loss: $440.64 (Below key support cluster and SMA 50)
💰 Profit Target: $508.97 (Previous highs + measured move extension)
📊 Risk/Reward Ratio: 1:2.8 (Exceptional for swing trade)
📉 Risk Management Notes:
Stop loss strategically placed below critical $450-455 support zone
Consider partial profit taking at $495-500 area
Monitor healthcare sector sentiment for broader market moves
Only 2% maximum portfolio risk per position recommended
Conclusion: HCA offers a clean technical setup with perfect alignment across timeframes and strong fundamental support. The exceptional risk-reward ratio makes this a high-probability swing trade opportunity.
Trade with discipline and proper position sizing!
Disclaimer: This is not investment advice. Conduct your own research and manage risk according to your personal tolerance and strategy.
#HCA #SwingTrading #Long #Healthcare #TechnicalAnalysis #Breakout #HCAHealthcare

Disclaimer
The information and publications are not meant to be, and do not constitute, financial, investment, trading, or other types of advice or recommendations supplied or endorsed by TradingView. Read more in the Terms of Use.
Disclaimer
The information and publications are not meant to be, and do not constitute, financial, investment, trading, or other types of advice or recommendations supplied or endorsed by TradingView. Read more in the Terms of Use.