
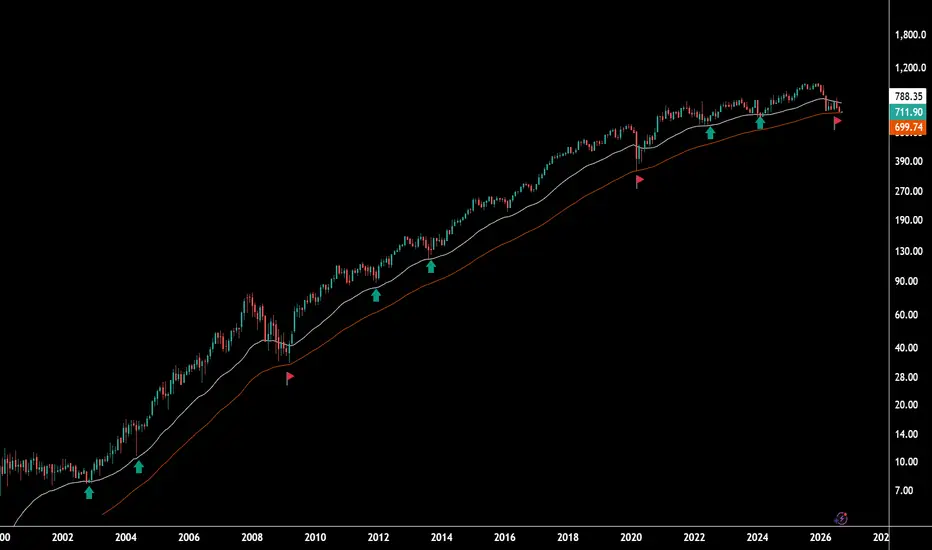
HDFC BANK – EMA SUPPORT RATIONALE 📊
HDFC Bank has repeatedly respected its EMA support at major turning points across different market cycles. The chart highlights similar reactions around 2012, 2013, 2022 and 2024, while the deeper EMA support was observed during the 2009 period and the 2020 crash.
Current Scenario: The stock is again taking support around this historical EMA zone.
Key EMA Support Zone: ₹682–₹700
Rationale: The repeated historical respect of this EMA makes ₹682–₹700 a critical long-term support zone. The current reaction from this area is therefore important for the next major directional move.

Disclaimer
The information and publications are not meant to be, and do not constitute, financial, investment, trading, or other types of advice or recommendations supplied or endorsed by TradingView. Read more in the Terms of Use.
Disclaimer
The information and publications are not meant to be, and do not constitute, financial, investment, trading, or other types of advice or recommendations supplied or endorsed by TradingView. Read more in the Terms of Use.