
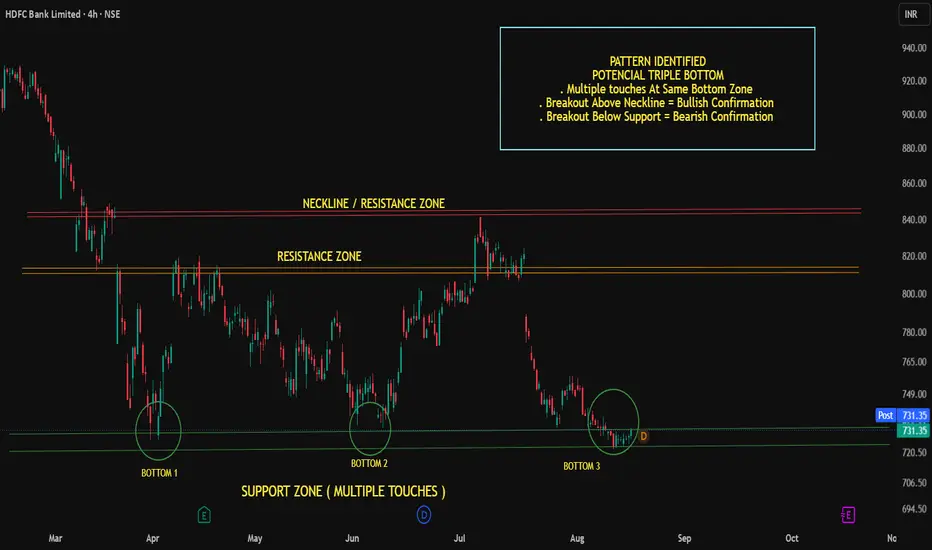
HDFC Bank is showing a potential Triple Bottom formation around the ₹720–₹730 support zone, where price has reacted multiple times.
🔹 Support Zone: ₹720–₹730
🔹 Resistance Zone: ₹815–₹820
🔹 Neckline: ₹840–₹845
Bullish Confirmation: A strong 4H candle close above ₹840–₹845 could confirm the breakout and indicate further upside potential.
Bearish Confirmation: A decisive breakdown below ₹720 could invalidate the bullish setup and signal further weakness.
📌 Key levels to watch: ₹720 support | ₹820 resistance | ₹840–₹845 neckline
This is a technical analysis setup, not a guaranteed outcome. Always manage risk and trade according to your own plan.
#HDFCBank #TechnicalAnalysis #TripleBottom #NSE #PriceAction #TradingView #SwingTrading
Trade active

Disclaimer
The information and publications are not meant to be, and do not constitute, financial, investment, trading, or other types of advice or recommendations supplied or endorsed by TradingView. Read more in the Terms of Use.
Disclaimer
The information and publications are not meant to be, and do not constitute, financial, investment, trading, or other types of advice or recommendations supplied or endorsed by TradingView. Read more in the Terms of Use.