
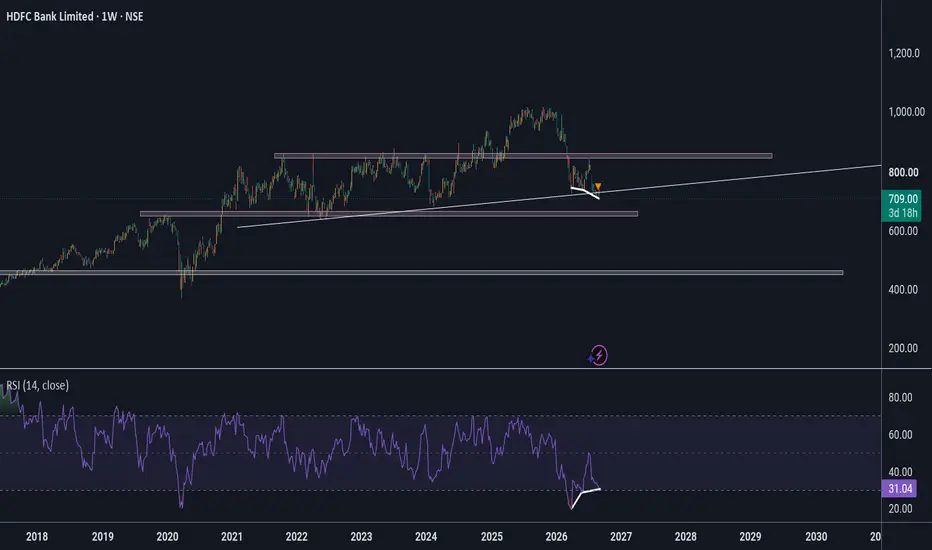
HDFCBANK is showing Bullish Divergence on RSI (on weekly Chart)
Important:-
It is rejected from historic high of 1000
Therefore high Kinetic energy
For confirmation HDFCBANK Must cross 770 level this or next week
HDFCBANK must show followup GREEN CANDLE to be Bullish 🐂
I am waiting for 770 Target because it is 50 SMA on Daily scale
Important:-
It is rejected from historic high of 1000
Therefore high Kinetic energy
For confirmation HDFCBANK Must cross 770 level this or next week
HDFCBANK must show followup GREEN CANDLE to be Bullish 🐂
I am waiting for 770 Target because it is 50 SMA on Daily scale

Disclaimer
The information and publications are not meant to be, and do not constitute, financial, investment, trading, or other types of advice or recommendations supplied or endorsed by TradingView. Read more in the Terms of Use.
Disclaimer
The information and publications are not meant to be, and do not constitute, financial, investment, trading, or other types of advice or recommendations supplied or endorsed by TradingView. Read more in the Terms of Use.