Happy New Year everyone!
May the joy continues spreading from the festive season for this year.
HSI had closed the year with a +27.77% ; ~5500+pts this has outperformed:-
S&P500 (i.e +16.39%; +963.87)
Nasdaq (i.e +20.17%; +4,237.67)
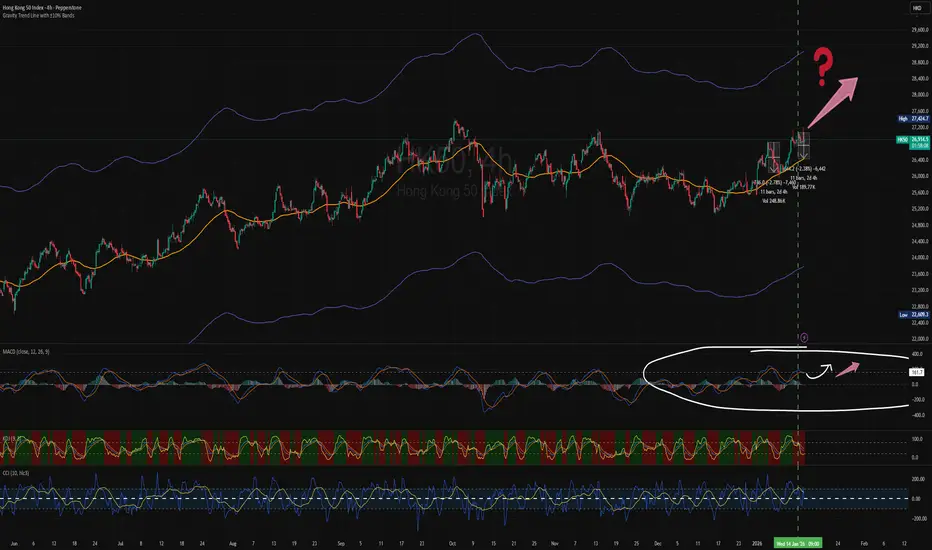
HSI kick-started the year with a rally with +700pts on the first trading day. A positive sign for the year.It will again move above the Gravity Trend Line (GTL) in 2026.
Also breaking out the sideway box and we shall monitor closely if this is consistent.
This week the Index likely to try testing the resistance level of 27381. This is supported by the MACD is crossing above ‘0’ level for D chart since late Nov’25.
For short-term - retracement is inevitable ; it should trade between the range of 26050 (D GTL) - 26570. If it breaks above 27381 and it’s likely to break as it has been retested for the 3rd time.
This could charge up to 27500 - 28670. The Index is going to continue to be Bullish.
📌 QUICK DECISION MAP (HSI HSI /HK50
 HK50 HKG33 )
Price Location Market Meaning Bias Primary Action
Above 27188 Trend acceleration Strong bullish Hold / add on shallow pullbacks
26700 – 27188 Bullish continuation Bullish Buy dips, trail stops
26050 – 26700 Trend under pressure Neutral → Bearish Reduce size, defensive trades
25090 – 26050 Trend failure Bearish Short rallies / stay in cash
4h ChartHK50

Cautious with the retracement,
MACD forming deadcross and probably sucking back to GTL level 26450.
Question: Are you going to take position now or wait for bigger risk/reward?
I don't have crystal ball, so look at the chart and see what the story it tells.
W chart show the MACD is curing up with a likely changing color histogram.
It's gonna bullish for HSI this year, at least Q1. Let's see!
27200-27380 Level is crucial to break for Bull to take charge.
However, when it reaches 30050-31070 level, markets & traders are likely to be acrophobic! In fact, am kind of a bit now!

Define your time frame and using the right chart
Long only everytime the price retrace touch/close to Gravity Trend Line (GTL) + Oversold zone - confirming using MACD + KDJ (MACD should be above '0' level if is continues Bullish.
Cross-check with smaller tf chart to confirm.
GTL is moving - monitor and enter accordingly.
Set your SL/TP manage risk.
Feel free to save the Gravity Trend Line (GTL) indicator if that helps you!
Be patient and the reward follow.
Happy Trading!
May the joy continues spreading from the festive season for this year.
HSI had closed the year with a +27.77% ; ~5500+pts this has outperformed:-
S&P500 (i.e +16.39%; +963.87)
Nasdaq (i.e +20.17%; +4,237.67)
HSI kick-started the year with a rally with +700pts on the first trading day. A positive sign for the year.It will again move above the Gravity Trend Line (GTL) in 2026.
Also breaking out the sideway box and we shall monitor closely if this is consistent.
This week the Index likely to try testing the resistance level of 27381. This is supported by the MACD is crossing above ‘0’ level for D chart since late Nov’25.
For short-term - retracement is inevitable ; it should trade between the range of 26050 (D GTL) - 26570. If it breaks above 27381 and it’s likely to break as it has been retested for the 3rd time.
This could charge up to 27500 - 28670. The Index is going to continue to be Bullish.
📌 QUICK DECISION MAP (HSI
HSI /HK50 HK50 HKG33 )Price Location Market Meaning Bias Primary Action
Above 27188 Trend acceleration Strong bullish Hold / add on shallow pullbacks
26700 – 27188 Bullish continuation Bullish Buy dips, trail stops
26050 – 26700 Trend under pressure Neutral → Bearish Reduce size, defensive trades
25090 – 26050 Trend failure Bearish Short rallies / stay in cash
4h Chart
HK50 Cautious with the retracement,
MACD forming deadcross and probably sucking back to GTL level 26450.
Question: Are you going to take position now or wait for bigger risk/reward?
I don't have crystal ball, so look at the chart and see what the story it tells.
W chart show the MACD is curing up with a likely changing color histogram.
It's gonna bullish for HSI this year, at least Q1. Let's see!
27200-27380 Level is crucial to break for Bull to take charge.
However, when it reaches 30050-31070 level, markets & traders are likely to be acrophobic! In fact, am kind of a bit now!
Define your time frame and using the right chart
Long only everytime the price retrace touch/close to Gravity Trend Line (GTL) + Oversold zone - confirming using MACD + KDJ (MACD should be above '0' level if is continues Bullish.
Cross-check with smaller tf chart to confirm.
GTL is moving - monitor and enter accordingly.
Set your SL/TP manage risk.
Feel free to save the Gravity Trend Line (GTL) indicator if that helps you!
Be patient and the reward follow.
Happy Trading!

Related publications
Disclaimer
The information and publications are not meant to be, and do not constitute, financial, investment, trading, or other types of advice or recommendations supplied or endorsed by TradingView. Read more in the Terms of Use.
Related publications
Disclaimer
The information and publications are not meant to be, and do not constitute, financial, investment, trading, or other types of advice or recommendations supplied or endorsed by TradingView. Read more in the Terms of Use.