 HSI
 HK50
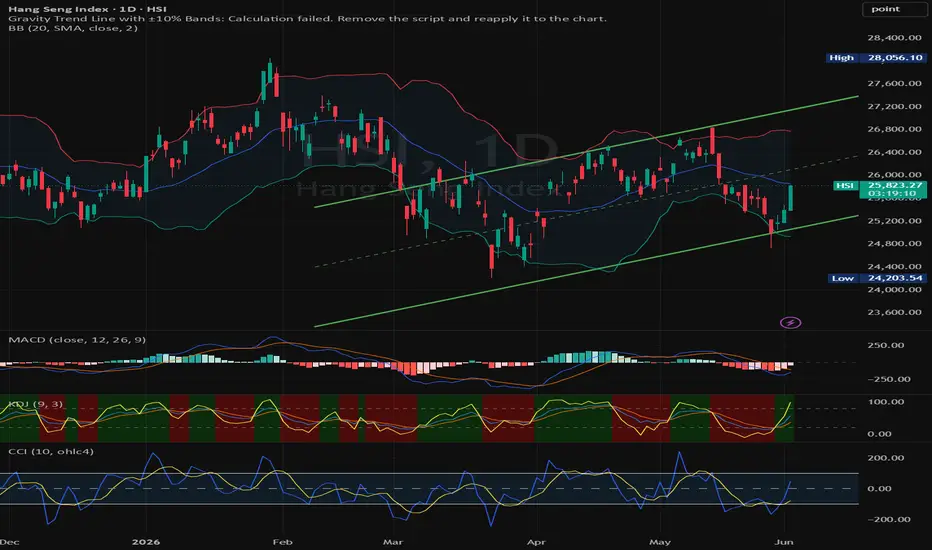
HSI is being retest and corrected recently and this week is key if it can reverse and close and stay above 25768 previous week high. and this week try to test & break resistance level at 25850.
It seems like we are at the same level back in March'26.
MACD
HSI 4H : forming golden cross with green histogram i.e bullish signal although below zero level.
1H : break above the zero today after forming golden cross below zero level on Thu after HSI close
HK50 4H : is about to cross above zero level with green histogram. This is a bullish signal.
1H : golden cross formed below zero level on Thu (after HSI closed) and Friday breakabove zero level.
Resistance/Support:
25830
25560
25185
For this week, to accumulate and long when it retrace to 25330-25400.
Aggressive swing trade : to Long at 25570-25585
D chart : GravityTrendLine : 25880
It's forecasting that the price movement shall be attracted back to touch GTL line.
Also from Fibo, it has break above the golden 0.618 level.
Feel free to save the Gravity Trend Line (GTL) indicator if that helps you.
This applies to most of the instruments and any time frame.
Manage your risk, be patient and reward follows.
Happy Trading!

Related publications
Disclaimer
The information and publications are not meant to be, and do not constitute, financial, investment, trading, or other types of advice or recommendations supplied or endorsed by TradingView. Read more in the Terms of Use.
Related publications
Disclaimer
The information and publications are not meant to be, and do not constitute, financial, investment, trading, or other types of advice or recommendations supplied or endorsed by TradingView. Read more in the Terms of Use.