
Before anything else, pay attention to the timeframe.
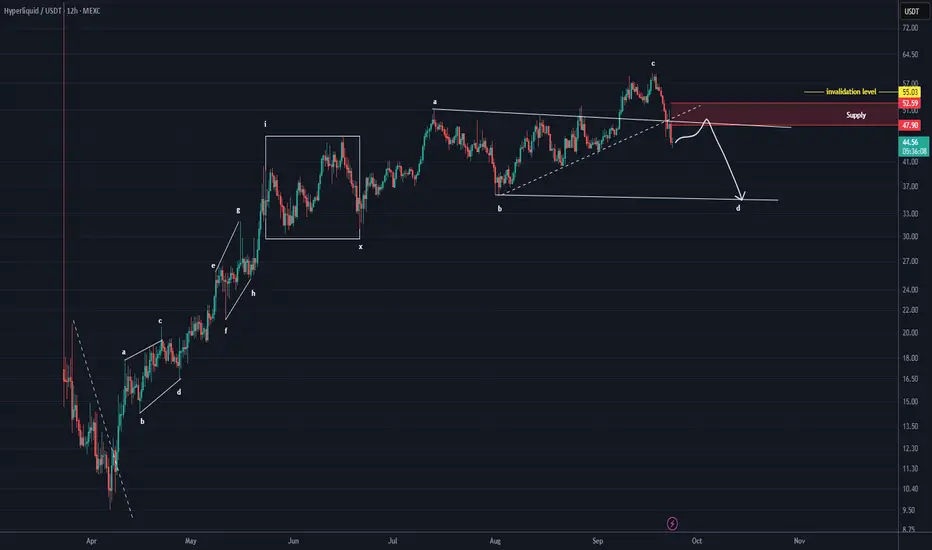
It seems we have a dual bullish phase on the chart, where the second phase is a triangle, and the price is likely to soon enter wave D of this second phase. The second phase is indeed a triangle.
Within the red-marked zone, we can look for sell/short setups.
You should aim for a reasonable profit target and manage your risk accordingly.
A daily candle close above the invalidation level will nullify this analysis.
For risk management, please don't forget stop loss and capital management
Comment if you have any questions
Thank You
Trade active
The initial reaction to the supply zone was good; it seems a pullback to the supply zone has occurred.Trade closed: target reached
The expected move was completed.It dropped by more than 42%.
✅ Join our Telegram channel to succeed in trading.
💎Our CRYPTO Telegram Channel: 👉 t.me/Behdark_EN
💎Our FOREX Telegram Channel: 👉 t.me/FX_Behdark
💎Our CRYPTO Telegram Channel: 👉 t.me/Behdark_EN
💎Our FOREX Telegram Channel: 👉 t.me/FX_Behdark
Disclaimer
The information and publications are not meant to be, and do not constitute, financial, investment, trading, or other types of advice or recommendations supplied or endorsed by TradingView. Read more in the Terms of Use.